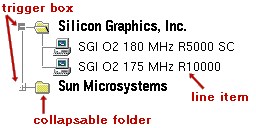
The Benchmark Visualizer uses a simple point-and-click graphical interface to build spreadsheets and manipulate graphs. Elements to be added to a spreadsheet are selected from Tree widgets that function like the Microsoft Windows95 Explorer. The active parts of the tree widget are the trigger box, collapsible folders, and selectable line items (see the figure below). Single-click on trigger boxes to expand their corresponding folder. Double-click on folders to expand them. Single-click on line items to select them and execute their associated action (in this case, add or remove the item to/from the spreadsheet -- de-selecting a line item causes it to be removed from the spreadsheet).
| Tree widget interface |

|
Spreadsheets are also active widgets (see the figure below). Select individual cells to take their action (add their data to a graph) or select entire rows or columns by clicking on the row/column header. Row and column selection uses an exclusive-OR policy (if you select a column, it deselects everything in the column that was previously selected and selects everything else). Each cell toggles is selection state and deselecting a cell takes the inverse action (i.e. removing data from the graph).
| Spreadsheet widget interface |

|
The main focus of the Benchmark Visualizer is the graph. All graph widgets are also active (see the figure below). All data added to or removed from an attached spreadsheet is automatically updated in the graph. Additionally you can change the scale from linear to logarithmic (log base 10) and back -- on a per axis basis (bar graphs only allow scaling on the y-axis since the x-axis contains non scalar values). Bar graphs also allow you to view the actual data represented by clicking the bar to get a persistent value cap (click again to remove the value cap). The legend is also active allowing you to scroll through a potentially sizeable list of entries. Some legend entries may also be active allowing you to select them like hypertext links to retrieve more specific information. Pop-up graph windows are also resizeable (all graph elements will resize to the new geometry).
| Graph widget interface |

|