|
Full-screen anti-aliasing and
how it is tested in SPECviewperf 10
by Allen Bourgoyne
SPECviewperf 10 includes new functionality to test performance for full-scene anti-aliasing (FSAA), a feature of most modern graphics cards. This document gives a brief description of FSAA, its benefits and limitations, and describes how to best interpret the results provided by SPECviewperf 10.
What is anti-aliasing?
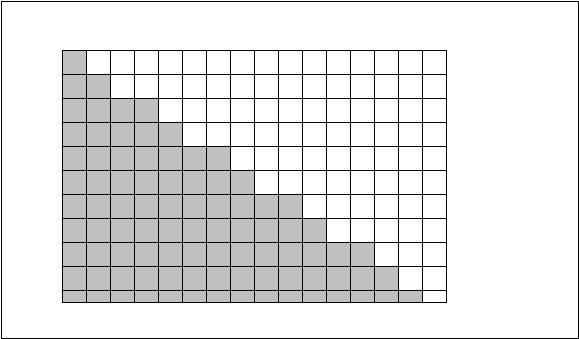
Anti-aliasing is a process that attempts to minimize the appearance of aliased or jagged diagonal edges, or “jaggies.” These jagged edges are the result of the finite resolution of the computer monitor that displays the graphics. Figure 1 illustrates how an edge should be represented when drawn graphically. Each square on the grid represents a single pixel on the display.

Figure1: Computed edge
Due to limitations of the screen resolution, however, the actual edge drawn is represented in Figure 2.

Figure 2: Actual rendered edge on the display
Since the lowest possible display resolution is a single pixel, it is not always possible to display the actual computed edge, but rather the closet approximation as shown in Figure 2. The jagged edge results in an image that is less than optimal from an aesthetic perspective.
Modern graphics hardware can minimize the effects of these jagged edges by anti-aliasing. There are several common techniques used to achieve anti-aliasing. The most common are super-sampling and multi-sampling.
With super-sampling, the image is up-scaled by a sample factor. The pixels around the target pixel are sampled, and then as the image is downsized back to the original. The target pixel’s color is modified as necessary with respect to the colors of the sampled pixels in order to make the edge look less jagged. Figure 3 is an example of how anti-aliasing is accomplished using super-sampling with four samples.

Figure 3: Super-sample with four samples
Super-sampling requires that the image be scaled up, sampled, and then scaled back to the original size. The graphics hardware must be able to perform these operations quickly in order to avoid significant performance penalties.
Multi-sampling is similar to super-sampling but does not require the image to be scaled up and down. The technique reuses samples from adjacent pixels to make the sampling process more efficient. Figure 4 is an example of how multi-sampling is accomplished using four samples.

Figure 4: Multi-sample with four samples
Graphics vendors are constantly striving to improve image quality. The examples here are just two of many techniques used to anti-alias rendered images. You should consult the documentation provided by your graphics hardware vendor to determine what types of FSAA rendering is supported.
Limitations of full-scene anti-aliasing
Like most algorithms, anti-aliasing techniques have limitations. By attempting to smooth jagged lines by adjusting the colors of pixels along the line, the actual image itself is altered. In some cases, the altered image is more desirable than the original image. A smoothed diagonal line, such as the edge of a building, is much more aesthetically pleasing than a jagged line, but text that is blurred may become unreadable.

Figure 5: Text rendering
Figure 5 shows text rendered with and without FSAA. As you can see from the image, the anti-aliased text appears blurry when compared to the text without FSAA. Some fonts are more suitable than others for anti-aliasing techniques. Text that is rendered by graphical techniques, such as OpenGL line drawing, may suffer more acutely from anti-aliasing.
Application developers often decide when it is useful to employ full-scene anti-aliasing. Many workstation applications use point and line anti-aliasing, but do not use FSAA, as they may want to render text or some other graphic that may not produce the desired result when FSAA is applied.
It is also important to note that graphics vendors use different techniques, algorithms and hardware to render FSAA images. It is difficult to directly compare the results from different vendors’ graphics cards or even across graphic card families from a single vendor, as the implementation of FSAA may vary between the products. Figure 6 contains screen image captures of the same graphic produced by two different graphics cards from two different manufacturers. Both used FSAA via multi-sampling with a sample size of two.

Figure 6: Multi-sample comparison between graphics cards
As you can see from Figure 6, even though both cards are rendering with the same FSAA sample size, the results have obvious differences. The graphic rendered is a series of triangles of decreasing width, converging on a single point in the center of the screen. The FSAA artifacts noticeable in the screenshot from Graphics Vendor #1 towards the center of the image have resulted in what appear to be curved lines, completely different than the intended graphic. The image from Graphics Vendor #2’s rendering also include some apparent curved lines, though less pronounced than those from Vendor #1.
Looking at the edges of individual lines, especially in the area of the purple lines, you can see where in some cases, Vendor #1’s effort smoothed the bottom of the triangle more effectively than Vendor #2, but for the same triangle, did a less effective job at smoothing the top of that triangle than the other vendor. Figure 7 highlights some of these differences. Closer examination of the images shows a number of subtle differences.

Figure 7: Image differences
As the simple images in Figure 6 show, it is difficult to do any kind of statistical or quantitative analysis of the FSAA images generated by different graphics cards. Which image is better in Figure 6? It’s a subjective judgment. Each card introduces subtle variations when rendering the exact same image. This is why many software application vendors choose not to use the graphics hardware FSAA capability, but instead implement their own software anti-aliasing algorithms. This is the only way to ensure consistent results regardless of the graphics card vendor’s FSAA implementation.
Interpreting SPECviewperf FSAA test results
SPECviewperf tests FSAA performance by running its standard test suite several times, setting the FSAA feature of the graphics card being tested to all possible FSAA sample values. If a graphics card supports up to 16 samples – supporting 16, 8, 4, and 2 samples – the test would run five times, running tests for 16, 8, 4, 2, and no samples.
The test is run with no FSAA enabled so that a baseline test result can be produced. The goal of the test is to determine what performance penalty, if any, enabling FSAA with a given sample rate incurs. During the individual tests, screen shots are captured. This allows the tester to review the effects that FSAA is having on the rendered image. It is important to note that as FSAA is altering the image, there is no way to automatically validate pixel accuracy of the images rendered. It is up to the tester to evaluate the individual image captures to determine if the FSAA-produced images for a given sample size are visually pleasing to the user. As mentioned earlier, a subjective evaluation is necessary as individual preference for the FSAA results plays a part with respect to the aesthetic quality of the images produced.
If the FSAA test produces a score that is within 10 percent of the non-FSAA score, under SPECviewperf 10 rules that score will be considered valid for the specific sample rate. If a SPECviewperf test score for a particular test is 20.0, for example, and the same test score with FSAA enabled with a sample of 8 produces 19.5, the official results will be listed as 20.0 with FSAA up to a sample of 8 enabled. Sample rates may affect individual tests differently with respect to performance, so each test will include the best FSAA sample rate score within the 10-percent threshold. If no sample rate falls within the 10-percent threshold, the test score will indicate that no FSAA sample rate achieved the performance threshold for this test.
In summary...
Full-scene anti-aliasing can be implemented in many ways, with varying results, even within a single graphics card vendor’s product line. Quality of images created with FSAA enabled is in the eyes of the beholder.
With its new testing for FSAA performance, SPECviewperf 10 relies on the tester to judge the visual quality of the image. FSAA performance is measured by the highest level of sampling achieved within 10 percent of the non-FSAA score.
###
Allen Bourgoyne is the Technical Marketing Manager for Workstation Graphics at AMD, and vice chair of the SPECopc project group.
|


