SPECpower_ssj2008
Host 'NODE01' Performance Report
Copyright © 2007-2018 Standard Performance Evaluation Corporation
| Hewlett Packard Enterprise Synergy 480 Gen10 Compute Module | ssj_ops@100% = 5,720,805 ssj_ops@100% per JVM = 1,430,201 |
||||
| Test Sponsor: | Hewlett Packard Enterprise | SPEC License #: | 3 | Test Method: | Multi Node |
| Tested By: | Hewlett Packard Enterprise | Test Location: | Houston, TX, USA | Test Date: | Apr 6, 2018 |
| Hardware Availability: | Jun-2018 | Software Availability: | Mar-2018 | Publication: | Apr 25, 2018 |
| System Source: | Single Supplier | System Designation: | Server | Power Provisioning: | Line-powered |
| Target Load | Actual Load | ssj_ops | |
|---|---|---|---|
| Target | Actual | ||
| Calibration 1 | 5,730,098 | ||
| Calibration 2 | 5,734,200 | ||
| Calibration 3 | 5,744,194 | ||
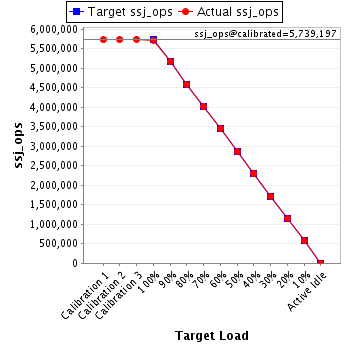
| ssj_ops@calibrated=5,739,197 | |||
| 100% | 99.7% | 5,739,197 | 5,720,805 |
| 90% | 90.0% | 5,165,277 | 5,167,078 |
| 80% | 79.9% | 4,591,357 | 4,585,267 |
| 70% | 70.0% | 4,017,438 | 4,018,131 |
| 60% | 60.1% | 3,443,518 | 3,447,686 |
| 50% | 49.8% | 2,869,598 | 2,860,472 |
| 40% | 40.0% | 2,295,679 | 2,296,017 |
| 30% | 30.0% | 1,721,759 | 1,720,289 |
| 20% | 20.0% | 1,147,839 | 1,150,637 |
| 10% | 10.0% | 573,920 | 574,937 |
| Active Idle | 0 | 0 | |
| Set Identifier: | SUT |
| Set Description: | System Under Test |
| # of Identical Nodes: | 12 |
| Comment: | SUT |
| Hardware | |
|---|---|
| Hardware Vendor: | Hewlett Packard Enterprise |
| Model: | Synergy 480 Gen10 Compute Module |
| Form Factor: | Other |
| CPU Name: | Intel Xeon Platinum 8180 2.50GHz |
| CPU Characteristics: | 28-Core, 2.50 GHz, 38.5 MB L3 Cache |
| CPU Frequency (MHz): | 2500 |
| CPU(s) Enabled: | 56 cores, 2 chips, 28 cores/chip |
| Hardware Threads: | 112 (2 / core) |
| CPU(s) Orderable: | 1,2 chips |
| Primary Cache: | 32 KB I + 32 KB D on chip per core |
| Secondary Cache: | 1 MB I+D on chip per core |
| Tertiary Cache: | 39424 KB I+D on chip per chip |
| Other Cache: | None |
| Memory Amount (GB): | 192 |
| # and size of DIMM: | 12 x 16384 MB |
| Memory Details: | 12 x 16GB 2Rx8 PC4-2666-V ECC; slots 1, 3, 5, 8, 10 and 12 populated on each CPU socket |
| Power Supply Quantity and Rating (W): | None |
| Power Supply Details: | Shared |
| Disk Drive: | 1 x HPE Synergy 480 Gen10 M.2 FIO Adapter Board Kit (873165-B21); 1 x HPE 480GB SATA 6G Read Intensive M.2 2280 SSD (875498-B21) |
| Disk Controller: | 1 x HPE Smart Array S100i SR Gen10 |
| # and type of Network Interface Cards (NICs) Installed: | 1 x HPE Synergy 3820C 10/20Gb 2-port Converged Network Adapter (777430-B21) |
| NICs Enabled in Firmware / OS / Connected: | 2/1/1 |
| Network Speed (Mbit): | 10000 |
| Keyboard: | None |
| Mouse: | None |
| Monitor: | None |
| Optical Drives: | No |
| Other Hardware: | None |
| Software | |
|---|---|
| Power Management: | Enabled (see SUT Notes) |
| Operating System (OS): | Windows Server 2012 R2 Datacenter |
| OS Version: | 6.3 (Build 9600) |
| Filesystem: | NTFS |
| JVM Vendor: | Oracle Corporation |
| JVM Version: | Java HotSpot(TM) 64-Bit Server VM (build 24.80-b11, mixed mode), version 1.7.0_80 |
| JVM Command-line Options: | -server -Xmn19g -Xms21g -Xmx21g -XX:SurvivorRatio=1 -XX:TargetSurvivorRatio=99 -XX:ParallelGCThreads=28 -XX:AllocatePrefetchDistance=256 -XX:AllocatePrefetchLines=4 -XX:LoopUnrollLimit=45 -XX:InitialTenuringThreshold=12 -XX:MaxTenuringThreshold=15 -XX:InlineSmallCode=9000 -XX:MaxInlineSize=270 -XX:FreqInlineSize=6000 -XX:+UseLargePages -XX:+UseParallelOldGC -XX:+AggressiveOpts |
| JVM Affinity: | start /NODE [0,1,2,3] /AFFINITY [0xFFFFFFF] |
| JVM Instances: | 4 |
| JVM Initial Heap (MB): | 21000 |
| JVM Maximum Heap (MB): | 21000 |
| JVM Address Bits: | 64 |
| Boot Firmware Version: | I42 v1.32 (02/01/2018) |
| Management Firmware Version: | 1.15 Aug 17 2017 |
| Workload Version: | SSJ 1.2.10 |
| Director Location: | Controller |
| Other Software: | HPE Composer Version 3.10.07 (HPE OneView) with HPE Synergy Custom SPP Bundle 2017.10.20180323; Microsoft Windows KB4054519, KB4056898 |
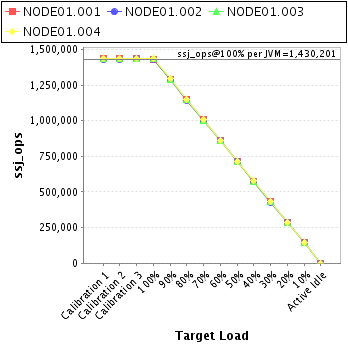
| JVM Instance | ssj_ops@100% |
|---|---|
| NODE01.001 | 1,426,889 |
| NODE01.002 | 1,428,250 |
| NODE01.003 | 1,432,795 |
| NODE01.004 | 1,432,872 |
| ssj_ops@100% | 5,720,805 |
| ssj_ops@100% per JVM | 1,430,201 |
| Target Load | Actual Load | ssj_ops | |
|---|---|---|---|
| Target | Actual | ||
| Calibration 1 | 1,433,501 | ||
| Calibration 2 | 1,433,316 | ||
| Calibration 3 | 1,434,385 | ||
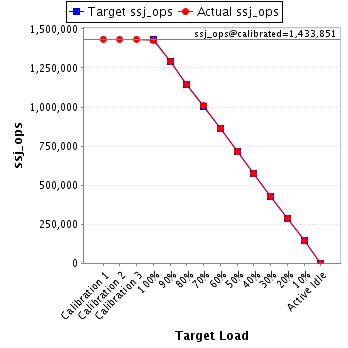
| ssj_ops@calibrated=1,433,851 | |||
| 100% | 99.5% | 1,433,851 | 1,426,889 |
| 90% | 90.0% | 1,290,466 | 1,289,997 |
| 80% | 80.0% | 1,147,081 | 1,146,840 |
| 70% | 70.3% | 1,003,695 | 1,007,297 |
| 60% | 60.2% | 860,310 | 862,903 |
| 50% | 49.9% | 716,925 | 714,941 |
| 40% | 39.9% | 573,540 | 572,611 |
| 30% | 30.0% | 430,155 | 430,235 |
| 20% | 20.2% | 286,770 | 288,957 |
| 10% | 10.1% | 143,385 | 144,367 |
| Active Idle | 0 | 0 | |
| Target Load | Actual Load | ssj_ops | |
|---|---|---|---|
| Target | Actual | ||
| Calibration 1 | 1,429,122 | ||
| Calibration 2 | 1,431,878 | ||
| Calibration 3 | 1,434,340 | ||
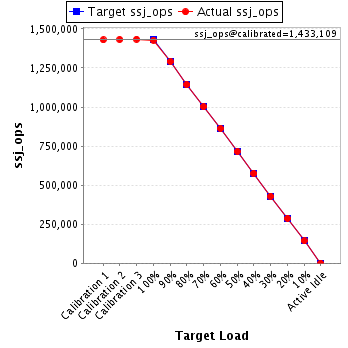
| ssj_ops@calibrated=1,433,109 | |||
| 100% | 99.7% | 1,433,109 | 1,428,250 |
| 90% | 90.1% | 1,289,798 | 1,291,035 |
| 80% | 79.8% | 1,146,487 | 1,143,675 |
| 70% | 69.9% | 1,003,176 | 1,002,155 |
| 60% | 60.2% | 859,865 | 862,871 |
| 50% | 49.9% | 716,554 | 715,497 |
| 40% | 40.1% | 573,244 | 574,512 |
| 30% | 30.0% | 429,933 | 429,594 |
| 20% | 20.1% | 286,622 | 287,605 |
| 10% | 10.0% | 143,311 | 143,093 |
| Active Idle | 0 | 0 | |
| Target Load | Actual Load | ssj_ops | |
|---|---|---|---|
| Target | Actual | ||
| Calibration 1 | 1,432,748 | ||
| Calibration 2 | 1,434,023 | ||
| Calibration 3 | 1,438,230 | ||
| ssj_ops@calibrated=1,436,126 | |||
| 100% | 99.8% | 1,436,126 | 1,432,795 |
| 90% | 90.0% | 1,292,514 | 1,292,196 |
| 80% | 79.9% | 1,148,901 | 1,147,615 |
| 70% | 69.9% | 1,005,289 | 1,003,239 |
| 60% | 60.1% | 861,676 | 862,416 |
| 50% | 49.8% | 718,063 | 715,548 |
| 40% | 39.8% | 574,451 | 571,663 |
| 30% | 30.0% | 430,838 | 430,591 |
| 20% | 19.9% | 287,225 | 286,049 |
| 10% | 10.0% | 143,613 | 144,021 |
| Active Idle | 0 | 0 | |

| Target Load | Actual Load | ssj_ops | |
|---|---|---|---|
| Target | Actual | ||
| Calibration 1 | 1,434,726 | ||
| Calibration 2 | 1,434,982 | ||
| Calibration 3 | 1,437,239 | ||
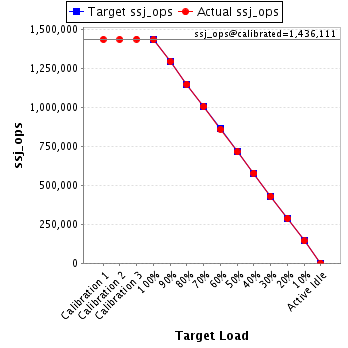
| ssj_ops@calibrated=1,436,111 | |||
| 100% | 99.8% | 1,436,111 | 1,432,872 |
| 90% | 90.1% | 1,292,500 | 1,293,851 |
| 80% | 79.9% | 1,148,889 | 1,147,137 |
| 70% | 70.0% | 1,005,278 | 1,005,440 |
| 60% | 59.8% | 861,666 | 859,497 |
| 50% | 49.8% | 718,055 | 714,487 |
| 40% | 40.2% | 574,444 | 577,231 |
| 30% | 29.9% | 430,833 | 429,868 |
| 20% | 20.1% | 287,222 | 288,027 |
| 10% | 10.0% | 143,611 | 143,457 |
| Active Idle | 0 | 0 | |