SPECpower_ssj2008
Host 'NODE03' Performance Report
Copyright © 2007-2018 Standard Performance Evaluation Corporation
| Hewlett Packard Enterprise Synergy 480 Gen10 Compute Module | ssj_ops@100% = 5,731,161 ssj_ops@100% per JVM = 1,432,790 |
||||
| Test Sponsor: | Hewlett Packard Enterprise | SPEC License #: | 3 | Test Method: | Multi Node |
| Tested By: | Hewlett Packard Enterprise | Test Location: | Houston, TX, USA | Test Date: | Apr 6, 2018 |
| Hardware Availability: | Jun-2018 | Software Availability: | Mar-2018 | Publication: | Apr 25, 2018 |
| System Source: | Single Supplier | System Designation: | Server | Power Provisioning: | Line-powered |
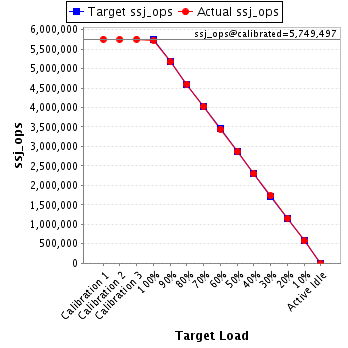
| Target Load | Actual Load | ssj_ops | |
|---|---|---|---|
| Target | Actual | ||
| Calibration 1 | 5,752,420 | ||
| Calibration 2 | 5,744,601 | ||
| Calibration 3 | 5,754,393 | ||
| ssj_ops@calibrated=5,749,497 | |||
| 100% | 99.7% | 5,749,497 | 5,731,161 |
| 90% | 89.9% | 5,174,548 | 5,170,896 |
| 80% | 80.1% | 4,599,598 | 4,602,905 |
| 70% | 70.0% | 4,024,648 | 4,023,414 |
| 60% | 60.0% | 3,449,698 | 3,446,947 |
| 50% | 50.0% | 2,874,749 | 2,873,112 |
| 40% | 39.9% | 2,299,799 | 2,293,932 |
| 30% | 30.0% | 1,724,849 | 1,727,563 |
| 20% | 20.0% | 1,149,899 | 1,152,238 |
| 10% | 10.0% | 574,950 | 576,231 |
| Active Idle | 0 | 0 | |
| Set Identifier: | SUT |
| Set Description: | System Under Test |
| # of Identical Nodes: | 12 |
| Comment: | SUT |
| Hardware | |
|---|---|
| Hardware Vendor: | Hewlett Packard Enterprise |
| Model: | Synergy 480 Gen10 Compute Module |
| Form Factor: | Other |
| CPU Name: | Intel Xeon Platinum 8180 2.50GHz |
| CPU Characteristics: | 28-Core, 2.50 GHz, 38.5 MB L3 Cache |
| CPU Frequency (MHz): | 2500 |
| CPU(s) Enabled: | 56 cores, 2 chips, 28 cores/chip |
| Hardware Threads: | 112 (2 / core) |
| CPU(s) Orderable: | 1,2 chips |
| Primary Cache: | 32 KB I + 32 KB D on chip per core |
| Secondary Cache: | 1 MB I+D on chip per core |
| Tertiary Cache: | 39424 KB I+D on chip per chip |
| Other Cache: | None |
| Memory Amount (GB): | 192 |
| # and size of DIMM: | 12 x 16384 MB |
| Memory Details: | 12 x 16GB 2Rx8 PC4-2666-V ECC; slots 1, 3, 5, 8, 10 and 12 populated on each CPU socket |
| Power Supply Quantity and Rating (W): | None |
| Power Supply Details: | Shared |
| Disk Drive: | 1 x HPE Synergy 480 Gen10 M.2 FIO Adapter Board Kit (873165-B21); 1 x HPE 480GB SATA 6G Read Intensive M.2 2280 SSD (875498-B21) |
| Disk Controller: | 1 x HPE Smart Array S100i SR Gen10 |
| # and type of Network Interface Cards (NICs) Installed: | 1 x HPE Synergy 3820C 10/20Gb 2-port Converged Network Adapter (777430-B21) |
| NICs Enabled in Firmware / OS / Connected: | 2/1/1 |
| Network Speed (Mbit): | 10000 |
| Keyboard: | None |
| Mouse: | None |
| Monitor: | None |
| Optical Drives: | No |
| Other Hardware: | None |
| Software | |
|---|---|
| Power Management: | Enabled (see SUT Notes) |
| Operating System (OS): | Windows Server 2012 R2 Datacenter |
| OS Version: | 6.3 (Build 9600) |
| Filesystem: | NTFS |
| JVM Vendor: | Oracle Corporation |
| JVM Version: | Java HotSpot(TM) 64-Bit Server VM (build 24.80-b11, mixed mode), version 1.7.0_80 |
| JVM Command-line Options: | -server -Xmn19g -Xms21g -Xmx21g -XX:SurvivorRatio=1 -XX:TargetSurvivorRatio=99 -XX:ParallelGCThreads=28 -XX:AllocatePrefetchDistance=256 -XX:AllocatePrefetchLines=4 -XX:LoopUnrollLimit=45 -XX:InitialTenuringThreshold=12 -XX:MaxTenuringThreshold=15 -XX:InlineSmallCode=9000 -XX:MaxInlineSize=270 -XX:FreqInlineSize=6000 -XX:+UseLargePages -XX:+UseParallelOldGC -XX:+AggressiveOpts |
| JVM Affinity: | start /NODE [0,1,2,3] /AFFINITY [0xFFFFFFF] |
| JVM Instances: | 4 |
| JVM Initial Heap (MB): | 21000 |
| JVM Maximum Heap (MB): | 21000 |
| JVM Address Bits: | 64 |
| Boot Firmware Version: | I42 v1.32 (02/01/2018) |
| Management Firmware Version: | 1.15 Aug 17 2017 |
| Workload Version: | SSJ 1.2.10 |
| Director Location: | Controller |
| Other Software: | HPE Composer Version 3.10.07 (HPE OneView) with HPE Synergy Custom SPP Bundle 2017.10.20180323; Microsoft Windows KB4054519, KB4056898 |
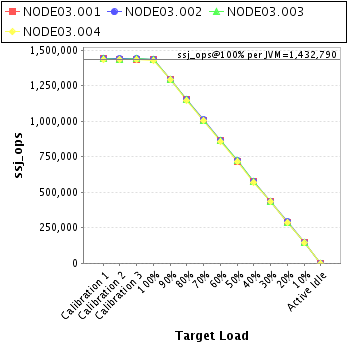
| JVM Instance | ssj_ops@100% |
|---|---|
| NODE03.001 | 1,433,649 |
| NODE03.002 | 1,436,084 |
| NODE03.003 | 1,432,844 |
| NODE03.004 | 1,428,585 |
| ssj_ops@100% | 5,731,161 |
| ssj_ops@100% per JVM | 1,432,790 |
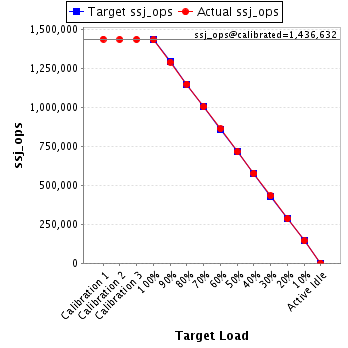
| Target Load | Actual Load | ssj_ops | |
|---|---|---|---|
| Target | Actual | ||
| Calibration 1 | 1,438,813 | ||
| Calibration 2 | 1,436,288 | ||
| Calibration 3 | 1,436,975 | ||
| ssj_ops@calibrated=1,436,632 | |||
| 100% | 99.8% | 1,436,632 | 1,433,649 |
| 90% | 89.9% | 1,292,969 | 1,291,525 |
| 80% | 80.1% | 1,149,305 | 1,150,128 |
| 70% | 69.9% | 1,005,642 | 1,004,757 |
| 60% | 60.1% | 861,979 | 862,807 |
| 50% | 49.8% | 718,316 | 716,061 |
| 40% | 40.1% | 574,653 | 576,330 |
| 30% | 30.1% | 430,990 | 432,017 |
| 20% | 19.9% | 287,326 | 285,640 |
| 10% | 10.1% | 143,663 | 144,756 |
| Active Idle | 0 | 0 | |
| Target Load | Actual Load | ssj_ops | |
|---|---|---|---|
| Target | Actual | ||
| Calibration 1 | 1,439,377 | ||
| Calibration 2 | 1,438,918 | ||
| Calibration 3 | 1,443,313 | ||
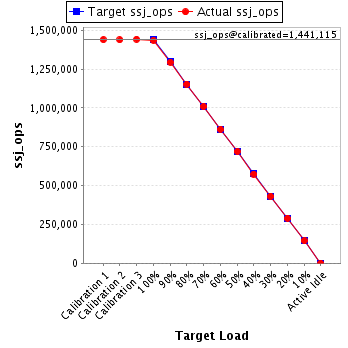
| ssj_ops@calibrated=1,441,115 | |||
| 100% | 99.7% | 1,441,115 | 1,436,084 |
| 90% | 89.8% | 1,297,004 | 1,294,546 |
| 80% | 80.1% | 1,152,892 | 1,153,738 |
| 70% | 70.1% | 1,008,781 | 1,010,311 |
| 60% | 59.9% | 864,669 | 863,592 |
| 50% | 49.9% | 720,558 | 719,820 |
| 40% | 39.9% | 576,446 | 574,884 |
| 30% | 30.0% | 432,335 | 432,049 |
| 20% | 20.2% | 288,223 | 290,538 |
| 10% | 10.1% | 144,112 | 144,896 |
| Active Idle | 0 | 0 | |
| Target Load | Actual Load | ssj_ops | |
|---|---|---|---|
| Target | Actual | ||
| Calibration 1 | 1,440,744 | ||
| Calibration 2 | 1,436,959 | ||
| Calibration 3 | 1,441,201 | ||
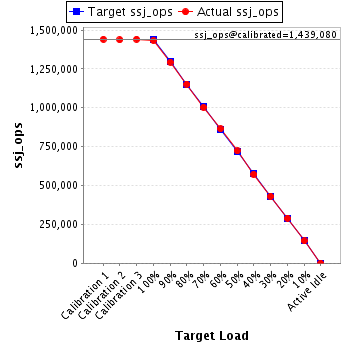
| ssj_ops@calibrated=1,439,080 | |||
| 100% | 99.6% | 1,439,080 | 1,432,844 |
| 90% | 89.9% | 1,295,172 | 1,293,671 |
| 80% | 80.0% | 1,151,264 | 1,151,977 |
| 70% | 69.7% | 1,007,356 | 1,003,736 |
| 60% | 60.0% | 863,448 | 864,047 |
| 50% | 50.2% | 719,540 | 722,151 |
| 40% | 39.8% | 575,632 | 572,081 |
| 30% | 30.0% | 431,724 | 431,337 |
| 20% | 20.1% | 287,816 | 289,955 |
| 10% | 10.0% | 143,908 | 143,746 |
| Active Idle | 0 | 0 | |
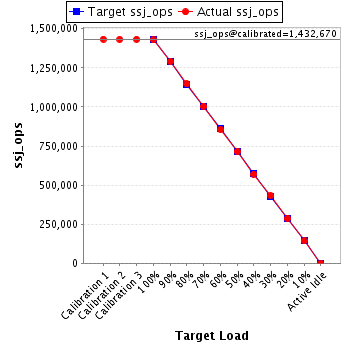
| Target Load | Actual Load | ssj_ops | |
|---|---|---|---|
| Target | Actual | ||
| Calibration 1 | 1,433,486 | ||
| Calibration 2 | 1,432,436 | ||
| Calibration 3 | 1,432,905 | ||
| ssj_ops@calibrated=1,432,670 | |||
| 100% | 99.7% | 1,432,670 | 1,428,585 |
| 90% | 90.1% | 1,289,403 | 1,291,154 |
| 80% | 80.1% | 1,146,136 | 1,147,063 |
| 70% | 70.1% | 1,002,869 | 1,004,611 |
| 60% | 59.8% | 859,602 | 856,502 |
| 50% | 49.9% | 716,335 | 715,079 |
| 40% | 39.8% | 573,068 | 570,638 |
| 30% | 30.2% | 429,801 | 432,160 |
| 20% | 20.0% | 286,534 | 286,105 |
| 10% | 10.0% | 143,267 | 142,833 |
| Active Idle | 0 | 0 | |