SPECpower_ssj2008
Host 'NODE04' Performance Report
Copyright © 2007-2018 Standard Performance Evaluation Corporation
| Hewlett Packard Enterprise Synergy 480 Gen10 Compute Module | ssj_ops@100% = 5,749,648 ssj_ops@100% per JVM = 1,437,412 |
||||
| Test Sponsor: | Hewlett Packard Enterprise | SPEC License #: | 3 | Test Method: | Multi Node |
| Tested By: | Hewlett Packard Enterprise | Test Location: | Houston, TX, USA | Test Date: | Apr 6, 2018 |
| Hardware Availability: | Jun-2018 | Software Availability: | Mar-2018 | Publication: | Apr 25, 2018 |
| System Source: | Single Supplier | System Designation: | Server | Power Provisioning: | Line-powered |
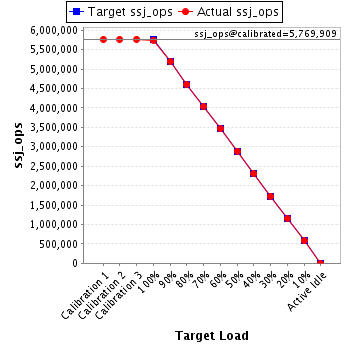
| Target Load | Actual Load | ssj_ops | |
|---|---|---|---|
| Target | Actual | ||
| Calibration 1 | 5,764,906 | ||
| Calibration 2 | 5,767,247 | ||
| Calibration 3 | 5,772,570 | ||
| ssj_ops@calibrated=5,769,909 | |||
| 100% | 99.6% | 5,769,909 | 5,749,648 |
| 90% | 90.0% | 5,192,918 | 5,192,683 |
| 80% | 79.8% | 4,615,927 | 4,606,072 |
| 70% | 70.0% | 4,038,936 | 4,040,386 |
| 60% | 60.0% | 3,461,945 | 3,461,572 |
| 50% | 50.0% | 2,884,954 | 2,884,743 |
| 40% | 40.0% | 2,307,963 | 2,305,969 |
| 30% | 30.0% | 1,730,973 | 1,729,043 |
| 20% | 20.0% | 1,153,982 | 1,154,260 |
| 10% | 10.0% | 576,991 | 576,995 |
| Active Idle | 0 | 0 | |
| Set Identifier: | SUT |
| Set Description: | System Under Test |
| # of Identical Nodes: | 12 |
| Comment: | SUT |
| Hardware | |
|---|---|
| Hardware Vendor: | Hewlett Packard Enterprise |
| Model: | Synergy 480 Gen10 Compute Module |
| Form Factor: | Other |
| CPU Name: | Intel Xeon Platinum 8180 2.50GHz |
| CPU Characteristics: | 28-Core, 2.50 GHz, 38.5 MB L3 Cache |
| CPU Frequency (MHz): | 2500 |
| CPU(s) Enabled: | 56 cores, 2 chips, 28 cores/chip |
| Hardware Threads: | 112 (2 / core) |
| CPU(s) Orderable: | 1,2 chips |
| Primary Cache: | 32 KB I + 32 KB D on chip per core |
| Secondary Cache: | 1 MB I+D on chip per core |
| Tertiary Cache: | 39424 KB I+D on chip per chip |
| Other Cache: | None |
| Memory Amount (GB): | 192 |
| # and size of DIMM: | 12 x 16384 MB |
| Memory Details: | 12 x 16GB 2Rx8 PC4-2666-V ECC; slots 1, 3, 5, 8, 10 and 12 populated on each CPU socket |
| Power Supply Quantity and Rating (W): | None |
| Power Supply Details: | Shared |
| Disk Drive: | 1 x HPE Synergy 480 Gen10 M.2 FIO Adapter Board Kit (873165-B21); 1 x HPE 480GB SATA 6G Read Intensive M.2 2280 SSD (875498-B21) |
| Disk Controller: | 1 x HPE Smart Array S100i SR Gen10 |
| # and type of Network Interface Cards (NICs) Installed: | 1 x HPE Synergy 3820C 10/20Gb 2-port Converged Network Adapter (777430-B21) |
| NICs Enabled in Firmware / OS / Connected: | 2/1/1 |
| Network Speed (Mbit): | 10000 |
| Keyboard: | None |
| Mouse: | None |
| Monitor: | None |
| Optical Drives: | No |
| Other Hardware: | None |
| Software | |
|---|---|
| Power Management: | Enabled (see SUT Notes) |
| Operating System (OS): | Windows Server 2012 R2 Datacenter |
| OS Version: | 6.3 (Build 9600) |
| Filesystem: | NTFS |
| JVM Vendor: | Oracle Corporation |
| JVM Version: | Java HotSpot(TM) 64-Bit Server VM (build 24.80-b11, mixed mode), version 1.7.0_80 |
| JVM Command-line Options: | -server -Xmn19g -Xms21g -Xmx21g -XX:SurvivorRatio=1 -XX:TargetSurvivorRatio=99 -XX:ParallelGCThreads=28 -XX:AllocatePrefetchDistance=256 -XX:AllocatePrefetchLines=4 -XX:LoopUnrollLimit=45 -XX:InitialTenuringThreshold=12 -XX:MaxTenuringThreshold=15 -XX:InlineSmallCode=9000 -XX:MaxInlineSize=270 -XX:FreqInlineSize=6000 -XX:+UseLargePages -XX:+UseParallelOldGC -XX:+AggressiveOpts |
| JVM Affinity: | start /NODE [0,1,2,3] /AFFINITY [0xFFFFFFF] |
| JVM Instances: | 4 |
| JVM Initial Heap (MB): | 21000 |
| JVM Maximum Heap (MB): | 21000 |
| JVM Address Bits: | 64 |
| Boot Firmware Version: | I42 v1.32 (02/01/2018) |
| Management Firmware Version: | 1.15 Aug 17 2017 |
| Workload Version: | SSJ 1.2.10 |
| Director Location: | Controller |
| Other Software: | HPE Composer Version 3.10.07 (HPE OneView) with HPE Synergy Custom SPP Bundle 2017.10.20180323; Microsoft Windows KB4054519, KB4056898 |
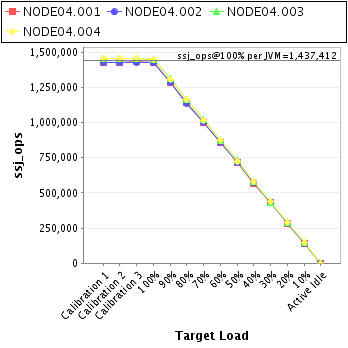
| JVM Instance | ssj_ops@100% |
|---|---|
| NODE04.001 | 1,426,781 |
| NODE04.002 | 1,424,751 |
| NODE04.003 | 1,451,453 |
| NODE04.004 | 1,446,663 |
| ssj_ops@100% | 5,749,648 |
| ssj_ops@100% per JVM | 1,437,412 |
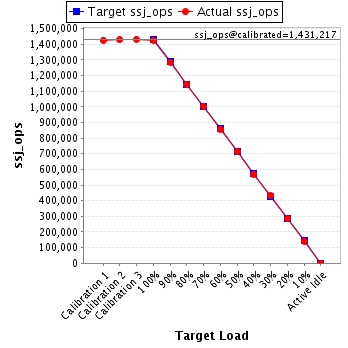
| Target Load | Actual Load | ssj_ops | |
|---|---|---|---|
| Target | Actual | ||
| Calibration 1 | 1,427,034 | ||
| Calibration 2 | 1,429,393 | ||
| Calibration 3 | 1,433,042 | ||
| ssj_ops@calibrated=1,431,217 | |||
| 100% | 99.7% | 1,431,217 | 1,426,781 |
| 90% | 89.9% | 1,288,096 | 1,286,593 |
| 80% | 80.0% | 1,144,974 | 1,145,229 |
| 70% | 70.0% | 1,001,852 | 1,002,164 |
| 60% | 59.9% | 858,730 | 857,641 |
| 50% | 50.0% | 715,609 | 715,519 |
| 40% | 39.8% | 572,487 | 570,019 |
| 30% | 30.1% | 429,365 | 430,274 |
| 20% | 20.0% | 286,243 | 285,900 |
| 10% | 9.9% | 143,122 | 141,941 |
| Active Idle | 0 | 0 | |
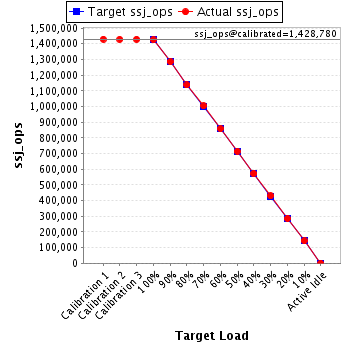
| Target Load | Actual Load | ssj_ops | |
|---|---|---|---|
| Target | Actual | ||
| Calibration 1 | 1,429,479 | ||
| Calibration 2 | 1,428,379 | ||
| Calibration 3 | 1,429,181 | ||
| ssj_ops@calibrated=1,428,780 | |||
| 100% | 99.7% | 1,428,780 | 1,424,751 |
| 90% | 90.0% | 1,285,902 | 1,285,747 |
| 80% | 79.6% | 1,143,024 | 1,137,224 |
| 70% | 70.2% | 1,000,146 | 1,003,245 |
| 60% | 60.0% | 857,268 | 857,505 |
| 50% | 50.0% | 714,390 | 714,353 |
| 40% | 40.0% | 571,512 | 571,431 |
| 30% | 30.0% | 428,634 | 429,114 |
| 20% | 19.9% | 285,756 | 284,579 |
| 10% | 10.0% | 142,878 | 142,856 |
| Active Idle | 0 | 0 | |
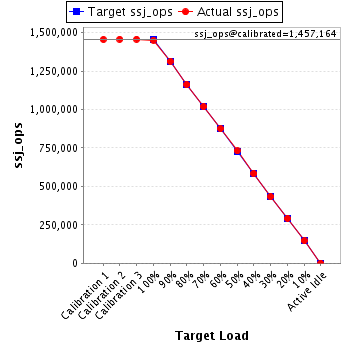
| Target Load | Actual Load | ssj_ops | |
|---|---|---|---|
| Target | Actual | ||
| Calibration 1 | 1,455,040 | ||
| Calibration 2 | 1,457,016 | ||
| Calibration 3 | 1,457,313 | ||
| ssj_ops@calibrated=1,457,164 | |||
| 100% | 99.6% | 1,457,164 | 1,451,453 |
| 90% | 90.2% | 1,311,448 | 1,313,813 |
| 80% | 79.8% | 1,165,732 | 1,162,098 |
| 70% | 69.9% | 1,020,015 | 1,019,002 |
| 60% | 60.0% | 874,299 | 874,604 |
| 50% | 50.1% | 728,582 | 730,355 |
| 40% | 40.0% | 582,866 | 582,649 |
| 30% | 29.7% | 437,149 | 432,694 |
| 20% | 20.0% | 291,433 | 291,730 |
| 10% | 10.0% | 145,716 | 146,419 |
| Active Idle | 0 | 0 | |
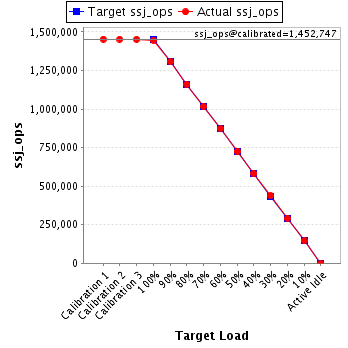
| Target Load | Actual Load | ssj_ops | |
|---|---|---|---|
| Target | Actual | ||
| Calibration 1 | 1,453,353 | ||
| Calibration 2 | 1,452,460 | ||
| Calibration 3 | 1,453,035 | ||
| ssj_ops@calibrated=1,452,747 | |||
| 100% | 99.6% | 1,452,747 | 1,446,663 |
| 90% | 89.9% | 1,307,473 | 1,306,530 |
| 80% | 80.0% | 1,162,198 | 1,161,521 |
| 70% | 69.9% | 1,016,923 | 1,015,976 |
| 60% | 60.0% | 871,648 | 871,821 |
| 50% | 49.9% | 726,374 | 724,515 |
| 40% | 40.1% | 581,099 | 581,870 |
| 30% | 30.1% | 435,824 | 436,961 |
| 20% | 20.1% | 290,549 | 292,051 |
| 10% | 10.0% | 145,275 | 145,779 |
| Active Idle | 0 | 0 | |