SPECpower_ssj2008
Host 'NODE05' Performance Report
Copyright © 2007-2018 Standard Performance Evaluation Corporation
| Hewlett Packard Enterprise Synergy 480 Gen10 Compute Module | ssj_ops@100% = 5,737,021 ssj_ops@100% per JVM = 1,434,255 |
||||
| Test Sponsor: | Hewlett Packard Enterprise | SPEC License #: | 3 | Test Method: | Multi Node |
| Tested By: | Hewlett Packard Enterprise | Test Location: | Houston, TX, USA | Test Date: | Apr 6, 2018 |
| Hardware Availability: | Jun-2018 | Software Availability: | Mar-2018 | Publication: | Apr 25, 2018 |
| System Source: | Single Supplier | System Designation: | Server | Power Provisioning: | Line-powered |
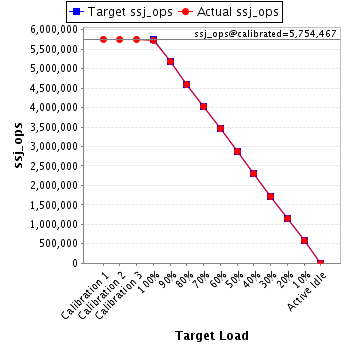
| Target Load | Actual Load | ssj_ops | |
|---|---|---|---|
| Target | Actual | ||
| Calibration 1 | 5,758,097 | ||
| Calibration 2 | 5,750,440 | ||
| Calibration 3 | 5,758,493 | ||
| ssj_ops@calibrated=5,754,467 | |||
| 100% | 99.7% | 5,754,467 | 5,737,021 |
| 90% | 90.0% | 5,179,020 | 5,178,974 |
| 80% | 79.9% | 4,603,573 | 4,598,285 |
| 70% | 70.0% | 4,028,127 | 4,029,628 |
| 60% | 60.1% | 3,452,680 | 3,455,576 |
| 50% | 50.0% | 2,877,233 | 2,875,047 |
| 40% | 39.9% | 2,301,787 | 2,298,421 |
| 30% | 29.9% | 1,726,340 | 1,719,851 |
| 20% | 19.9% | 1,150,893 | 1,147,797 |
| 10% | 10.0% | 575,447 | 573,807 |
| Active Idle | 0 | 0 | |
| Set Identifier: | SUT |
| Set Description: | System Under Test |
| # of Identical Nodes: | 12 |
| Comment: | SUT |
| Hardware | |
|---|---|
| Hardware Vendor: | Hewlett Packard Enterprise |
| Model: | Synergy 480 Gen10 Compute Module |
| Form Factor: | Other |
| CPU Name: | Intel Xeon Platinum 8180 2.50GHz |
| CPU Characteristics: | 28-Core, 2.50 GHz, 38.5 MB L3 Cache |
| CPU Frequency (MHz): | 2500 |
| CPU(s) Enabled: | 56 cores, 2 chips, 28 cores/chip |
| Hardware Threads: | 112 (2 / core) |
| CPU(s) Orderable: | 1,2 chips |
| Primary Cache: | 32 KB I + 32 KB D on chip per core |
| Secondary Cache: | 1 MB I+D on chip per core |
| Tertiary Cache: | 39424 KB I+D on chip per chip |
| Other Cache: | None |
| Memory Amount (GB): | 192 |
| # and size of DIMM: | 12 x 16384 MB |
| Memory Details: | 12 x 16GB 2Rx8 PC4-2666-V ECC; slots 1, 3, 5, 8, 10 and 12 populated on each CPU socket |
| Power Supply Quantity and Rating (W): | None |
| Power Supply Details: | Shared |
| Disk Drive: | 1 x HPE Synergy 480 Gen10 M.2 FIO Adapter Board Kit (873165-B21); 1 x HPE 480GB SATA 6G Read Intensive M.2 2280 SSD (875498-B21) |
| Disk Controller: | 1 x HPE Smart Array S100i SR Gen10 |
| # and type of Network Interface Cards (NICs) Installed: | 1 x HPE Synergy 3820C 10/20Gb 2-port Converged Network Adapter (777430-B21) |
| NICs Enabled in Firmware / OS / Connected: | 2/1/1 |
| Network Speed (Mbit): | 10000 |
| Keyboard: | None |
| Mouse: | None |
| Monitor: | None |
| Optical Drives: | No |
| Other Hardware: | None |
| Software | |
|---|---|
| Power Management: | Enabled (see SUT Notes) |
| Operating System (OS): | Windows Server 2012 R2 Datacenter |
| OS Version: | 6.3 (Build 9600) |
| Filesystem: | NTFS |
| JVM Vendor: | Oracle Corporation |
| JVM Version: | Java HotSpot(TM) 64-Bit Server VM (build 24.80-b11, mixed mode), version 1.7.0_80 |
| JVM Command-line Options: | -server -Xmn19g -Xms21g -Xmx21g -XX:SurvivorRatio=1 -XX:TargetSurvivorRatio=99 -XX:ParallelGCThreads=28 -XX:AllocatePrefetchDistance=256 -XX:AllocatePrefetchLines=4 -XX:LoopUnrollLimit=45 -XX:InitialTenuringThreshold=12 -XX:MaxTenuringThreshold=15 -XX:InlineSmallCode=9000 -XX:MaxInlineSize=270 -XX:FreqInlineSize=6000 -XX:+UseLargePages -XX:+UseParallelOldGC -XX:+AggressiveOpts |
| JVM Affinity: | start /NODE [0,1,2,3] /AFFINITY [0xFFFFFFF] |
| JVM Instances: | 4 |
| JVM Initial Heap (MB): | 21000 |
| JVM Maximum Heap (MB): | 21000 |
| JVM Address Bits: | 64 |
| Boot Firmware Version: | I42 v1.32 (02/01/2018) |
| Management Firmware Version: | 1.15 Aug 17 2017 |
| Workload Version: | SSJ 1.2.10 |
| Director Location: | Controller |
| Other Software: | HPE Composer Version 3.10.07 (HPE OneView) with HPE Synergy Custom SPP Bundle 2017.10.20180323; Microsoft Windows KB4054519, KB4056898 |
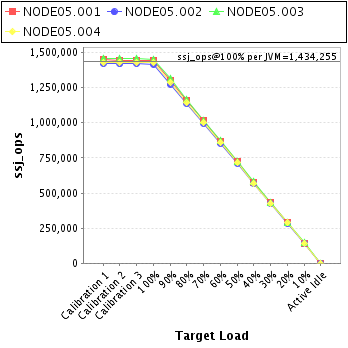
| JVM Instance | ssj_ops@100% |
|---|---|
| NODE05.001 | 1,440,614 |
| NODE05.002 | 1,416,299 |
| NODE05.003 | 1,453,787 |
| NODE05.004 | 1,426,321 |
| ssj_ops@100% | 5,737,021 |
| ssj_ops@100% per JVM | 1,434,255 |
| Target Load | Actual Load | ssj_ops | |
|---|---|---|---|
| Target | Actual | ||
| Calibration 1 | 1,447,806 | ||
| Calibration 2 | 1,445,825 | ||
| Calibration 3 | 1,446,210 | ||
| ssj_ops@calibrated=1,446,018 | |||
| 100% | 99.6% | 1,446,018 | 1,440,614 |
| 90% | 90.0% | 1,301,416 | 1,301,879 |
| 80% | 80.0% | 1,156,814 | 1,157,444 |
| 70% | 70.1% | 1,012,212 | 1,013,139 |
| 60% | 60.0% | 867,611 | 867,823 |
| 50% | 49.9% | 723,009 | 720,880 |
| 40% | 39.8% | 578,407 | 576,234 |
| 30% | 29.8% | 433,805 | 431,230 |
| 20% | 19.9% | 289,204 | 287,123 |
| 10% | 9.9% | 144,602 | 143,375 |
| Active Idle | 0 | 0 | |

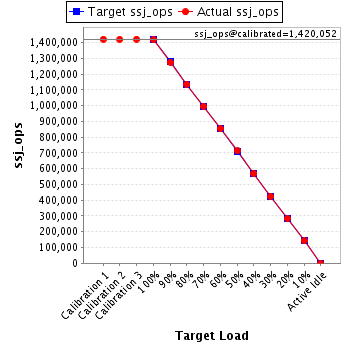
| Target Load | Actual Load | ssj_ops | |
|---|---|---|---|
| Target | Actual | ||
| Calibration 1 | 1,421,012 | ||
| Calibration 2 | 1,418,845 | ||
| Calibration 3 | 1,421,260 | ||
| ssj_ops@calibrated=1,420,052 | |||
| 100% | 99.7% | 1,420,052 | 1,416,299 |
| 90% | 89.8% | 1,278,047 | 1,274,844 |
| 80% | 80.0% | 1,136,042 | 1,136,225 |
| 70% | 70.1% | 994,037 | 995,975 |
| 60% | 60.1% | 852,031 | 853,559 |
| 50% | 50.1% | 710,026 | 712,061 |
| 40% | 40.0% | 568,021 | 567,396 |
| 30% | 29.9% | 426,016 | 424,657 |
| 20% | 20.0% | 284,010 | 283,475 |
| 10% | 10.0% | 142,005 | 141,727 |
| Active Idle | 0 | 0 | |
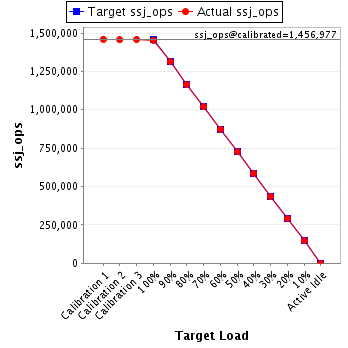
| Target Load | Actual Load | ssj_ops | |
|---|---|---|---|
| Target | Actual | ||
| Calibration 1 | 1,459,862 | ||
| Calibration 2 | 1,454,879 | ||
| Calibration 3 | 1,459,076 | ||
| ssj_ops@calibrated=1,456,977 | |||
| 100% | 99.8% | 1,456,977 | 1,453,787 |
| 90% | 90.1% | 1,311,280 | 1,312,919 |
| 80% | 79.8% | 1,165,582 | 1,163,267 |
| 70% | 69.9% | 1,019,884 | 1,018,174 |
| 60% | 60.0% | 874,186 | 874,590 |
| 50% | 49.8% | 728,489 | 725,084 |
| 40% | 40.1% | 582,791 | 584,518 |
| 30% | 29.9% | 437,093 | 435,072 |
| 20% | 19.9% | 291,395 | 290,191 |
| 10% | 10.0% | 145,698 | 145,642 |
| Active Idle | 0 | 0 | |
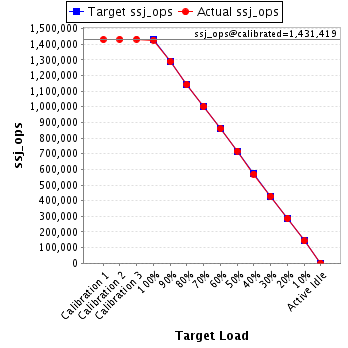
| Target Load | Actual Load | ssj_ops | |
|---|---|---|---|
| Target | Actual | ||
| Calibration 1 | 1,429,417 | ||
| Calibration 2 | 1,430,891 | ||
| Calibration 3 | 1,431,947 | ||
| ssj_ops@calibrated=1,431,419 | |||
| 100% | 99.6% | 1,431,419 | 1,426,321 |
| 90% | 90.1% | 1,288,277 | 1,289,332 |
| 80% | 79.7% | 1,145,136 | 1,141,349 |
| 70% | 70.0% | 1,001,994 | 1,002,340 |
| 60% | 60.1% | 858,852 | 859,604 |
| 50% | 50.1% | 715,710 | 717,022 |
| 40% | 39.8% | 572,568 | 570,272 |
| 30% | 30.0% | 429,426 | 428,893 |
| 20% | 20.1% | 286,284 | 287,008 |
| 10% | 10.0% | 143,142 | 143,063 |
| Active Idle | 0 | 0 | |