SPECpower_ssj2008
Host 'NODE06' Performance Report
Copyright © 2007-2018 Standard Performance Evaluation Corporation
| Hewlett Packard Enterprise Synergy 480 Gen10 Compute Module | ssj_ops@100% = 5,710,194 ssj_ops@100% per JVM = 1,427,549 |
||||
| Test Sponsor: | Hewlett Packard Enterprise | SPEC License #: | 3 | Test Method: | Multi Node |
| Tested By: | Hewlett Packard Enterprise | Test Location: | Houston, TX, USA | Test Date: | Apr 6, 2018 |
| Hardware Availability: | Jun-2018 | Software Availability: | Mar-2018 | Publication: | Apr 25, 2018 |
| System Source: | Single Supplier | System Designation: | Server | Power Provisioning: | Line-powered |
| Target Load | Actual Load | ssj_ops | |
|---|---|---|---|
| Target | Actual | ||
| Calibration 1 | 5,732,906 | ||
| Calibration 2 | 5,728,837 | ||
| Calibration 3 | 5,733,780 | ||
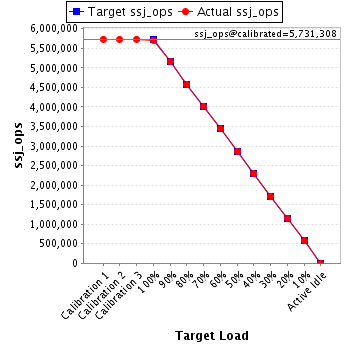
| ssj_ops@calibrated=5,731,308 | |||
| 100% | 99.6% | 5,731,308 | 5,710,194 |
| 90% | 90.0% | 5,158,177 | 5,156,599 |
| 80% | 80.0% | 4,585,047 | 4,585,404 |
| 70% | 69.9% | 4,011,916 | 4,007,973 |
| 60% | 60.1% | 3,438,785 | 3,443,239 |
| 50% | 49.9% | 2,865,654 | 2,862,787 |
| 40% | 40.0% | 2,292,523 | 2,290,348 |
| 30% | 30.0% | 1,719,392 | 1,719,395 |
| 20% | 20.0% | 1,146,262 | 1,145,989 |
| 10% | 10.0% | 573,131 | 573,329 |
| Active Idle | 0 | 0 | |
| Set Identifier: | SUT |
| Set Description: | System Under Test |
| # of Identical Nodes: | 12 |
| Comment: | SUT |
| Hardware | |
|---|---|
| Hardware Vendor: | Hewlett Packard Enterprise |
| Model: | Synergy 480 Gen10 Compute Module |
| Form Factor: | Other |
| CPU Name: | Intel Xeon Platinum 8180 2.50GHz |
| CPU Characteristics: | 28-Core, 2.50 GHz, 38.5 MB L3 Cache |
| CPU Frequency (MHz): | 2500 |
| CPU(s) Enabled: | 56 cores, 2 chips, 28 cores/chip |
| Hardware Threads: | 112 (2 / core) |
| CPU(s) Orderable: | 1,2 chips |
| Primary Cache: | 32 KB I + 32 KB D on chip per core |
| Secondary Cache: | 1 MB I+D on chip per core |
| Tertiary Cache: | 39424 KB I+D on chip per chip |
| Other Cache: | None |
| Memory Amount (GB): | 192 |
| # and size of DIMM: | 12 x 16384 MB |
| Memory Details: | 12 x 16GB 2Rx8 PC4-2666-V ECC; slots 1, 3, 5, 8, 10 and 12 populated on each CPU socket |
| Power Supply Quantity and Rating (W): | None |
| Power Supply Details: | Shared |
| Disk Drive: | 1 x HPE Synergy 480 Gen10 M.2 FIO Adapter Board Kit (873165-B21); 1 x HPE 480GB SATA 6G Read Intensive M.2 2280 SSD (875498-B21) |
| Disk Controller: | 1 x HPE Smart Array S100i SR Gen10 |
| # and type of Network Interface Cards (NICs) Installed: | 1 x HPE Synergy 3820C 10/20Gb 2-port Converged Network Adapter (777430-B21) |
| NICs Enabled in Firmware / OS / Connected: | 2/1/1 |
| Network Speed (Mbit): | 10000 |
| Keyboard: | None |
| Mouse: | None |
| Monitor: | None |
| Optical Drives: | No |
| Other Hardware: | None |
| Software | |
|---|---|
| Power Management: | Enabled (see SUT Notes) |
| Operating System (OS): | Windows Server 2012 R2 Datacenter |
| OS Version: | 6.3 (Build 9600) |
| Filesystem: | NTFS |
| JVM Vendor: | Oracle Corporation |
| JVM Version: | Java HotSpot(TM) 64-Bit Server VM (build 24.80-b11, mixed mode), version 1.7.0_80 |
| JVM Command-line Options: | -server -Xmn19g -Xms21g -Xmx21g -XX:SurvivorRatio=1 -XX:TargetSurvivorRatio=99 -XX:ParallelGCThreads=28 -XX:AllocatePrefetchDistance=256 -XX:AllocatePrefetchLines=4 -XX:LoopUnrollLimit=45 -XX:InitialTenuringThreshold=12 -XX:MaxTenuringThreshold=15 -XX:InlineSmallCode=9000 -XX:MaxInlineSize=270 -XX:FreqInlineSize=6000 -XX:+UseLargePages -XX:+UseParallelOldGC -XX:+AggressiveOpts |
| JVM Affinity: | start /NODE [0,1,2,3] /AFFINITY [0xFFFFFFF] |
| JVM Instances: | 4 |
| JVM Initial Heap (MB): | 21000 |
| JVM Maximum Heap (MB): | 21000 |
| JVM Address Bits: | 64 |
| Boot Firmware Version: | I42 v1.32 (02/01/2018) |
| Management Firmware Version: | 1.15 Aug 17 2017 |
| Workload Version: | SSJ 1.2.10 |
| Director Location: | Controller |
| Other Software: | HPE Composer Version 3.10.07 (HPE OneView) with HPE Synergy Custom SPP Bundle 2017.10.20180323; Microsoft Windows KB4054519, KB4056898 |
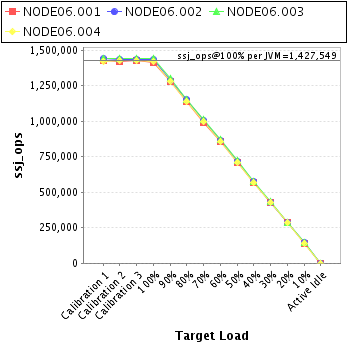
| JVM Instance | ssj_ops@100% |
|---|---|
| NODE06.001 | 1,412,743 |
| NODE06.002 | 1,434,629 |
| NODE06.003 | 1,439,818 |
| NODE06.004 | 1,423,004 |
| ssj_ops@100% | 5,710,194 |
| ssj_ops@100% per JVM | 1,427,549 |
| Target Load | Actual Load | ssj_ops | |
|---|---|---|---|
| Target | Actual | ||
| Calibration 1 | 1,424,780 | ||
| Calibration 2 | 1,422,337 | ||
| Calibration 3 | 1,428,174 | ||
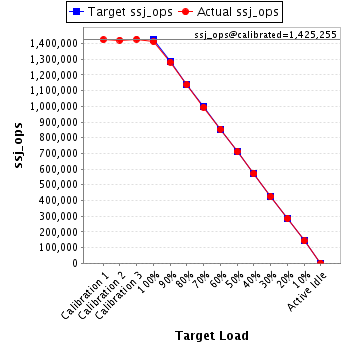
| ssj_ops@calibrated=1,425,255 | |||
| 100% | 99.1% | 1,425,255 | 1,412,743 |
| 90% | 89.9% | 1,282,730 | 1,282,012 |
| 80% | 79.8% | 1,140,204 | 1,137,541 |
| 70% | 69.8% | 997,679 | 994,811 |
| 60% | 60.0% | 855,153 | 854,965 |
| 50% | 49.9% | 712,628 | 711,616 |
| 40% | 40.0% | 570,102 | 570,419 |
| 30% | 29.8% | 427,577 | 424,596 |
| 20% | 20.0% | 285,051 | 284,970 |
| 10% | 10.0% | 142,526 | 142,339 |
| Active Idle | 0 | 0 | |
| Target Load | Actual Load | ssj_ops | |
|---|---|---|---|
| Target | Actual | ||
| Calibration 1 | 1,439,165 | ||
| Calibration 2 | 1,437,106 | ||
| Calibration 3 | 1,437,445 | ||
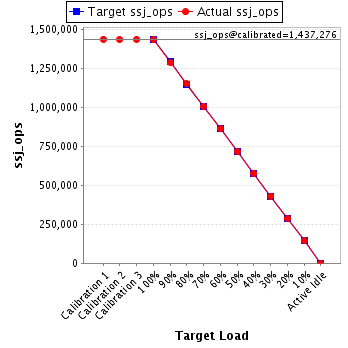
| ssj_ops@calibrated=1,437,276 | |||
| 100% | 99.8% | 1,437,276 | 1,434,629 |
| 90% | 89.7% | 1,293,548 | 1,289,576 |
| 80% | 80.2% | 1,149,821 | 1,153,071 |
| 70% | 70.1% | 1,006,093 | 1,007,551 |
| 60% | 60.0% | 862,365 | 862,374 |
| 50% | 49.9% | 718,638 | 717,162 |
| 40% | 40.1% | 574,910 | 576,313 |
| 30% | 30.0% | 431,183 | 430,898 |
| 20% | 20.0% | 287,455 | 286,868 |
| 10% | 10.0% | 143,728 | 144,385 |
| Active Idle | 0 | 0 | |
| Target Load | Actual Load | ssj_ops | |
|---|---|---|---|
| Target | Actual | ||
| Calibration 1 | 1,444,632 | ||
| Calibration 2 | 1,444,541 | ||
| Calibration 3 | 1,441,485 | ||
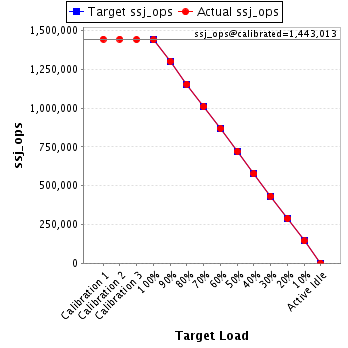
| ssj_ops@calibrated=1,443,013 | |||
| 100% | 99.8% | 1,443,013 | 1,439,818 |
| 90% | 90.2% | 1,298,712 | 1,301,969 |
| 80% | 80.0% | 1,154,410 | 1,153,785 |
| 70% | 70.0% | 1,010,109 | 1,010,185 |
| 60% | 60.2% | 865,808 | 868,717 |
| 50% | 50.0% | 721,507 | 721,375 |
| 40% | 39.9% | 577,205 | 576,060 |
| 30% | 30.0% | 432,904 | 433,342 |
| 20% | 20.0% | 288,603 | 288,599 |
| 10% | 10.0% | 144,301 | 144,251 |
| Active Idle | 0 | 0 | |
| Target Load | Actual Load | ssj_ops | |
|---|---|---|---|
| Target | Actual | ||
| Calibration 1 | 1,424,329 | ||
| Calibration 2 | 1,424,853 | ||
| Calibration 3 | 1,426,675 | ||
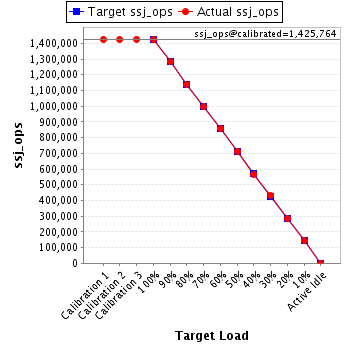
| ssj_ops@calibrated=1,425,764 | |||
| 100% | 99.8% | 1,425,764 | 1,423,004 |
| 90% | 90.0% | 1,283,188 | 1,283,041 |
| 80% | 80.0% | 1,140,611 | 1,141,007 |
| 70% | 69.8% | 998,035 | 995,426 |
| 60% | 60.1% | 855,459 | 857,183 |
| 50% | 50.0% | 712,882 | 712,635 |
| 40% | 39.8% | 570,306 | 567,555 |
| 30% | 30.2% | 427,729 | 430,560 |
| 20% | 20.0% | 285,153 | 285,551 |
| 10% | 10.0% | 142,576 | 142,354 |
| Active Idle | 0 | 0 | |