SPECpower_ssj2008
Host 'NODE08' Performance Report
Copyright © 2007-2018 Standard Performance Evaluation Corporation
| Hewlett Packard Enterprise Synergy 480 Gen10 Compute Module | ssj_ops@100% = 5,718,513 ssj_ops@100% per JVM = 1,429,628 |
||||
| Test Sponsor: | Hewlett Packard Enterprise | SPEC License #: | 3 | Test Method: | Multi Node |
| Tested By: | Hewlett Packard Enterprise | Test Location: | Houston, TX, USA | Test Date: | Apr 6, 2018 |
| Hardware Availability: | Jun-2018 | Software Availability: | Mar-2018 | Publication: | Apr 25, 2018 |
| System Source: | Single Supplier | System Designation: | Server | Power Provisioning: | Line-powered |
| Target Load | Actual Load | ssj_ops | |
|---|---|---|---|
| Target | Actual | ||
| Calibration 1 | 5,752,307 | ||
| Calibration 2 | 5,738,986 | ||
| Calibration 3 | 5,747,648 | ||
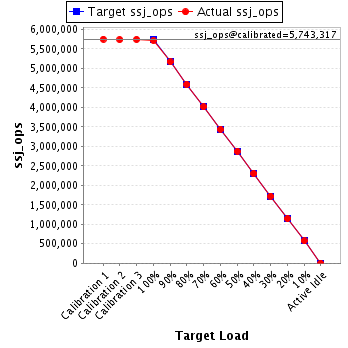
| ssj_ops@calibrated=5,743,317 | |||
| 100% | 99.6% | 5,743,317 | 5,718,513 |
| 90% | 90.0% | 5,168,986 | 5,168,014 |
| 80% | 79.9% | 4,594,654 | 4,591,493 |
| 70% | 69.9% | 4,020,322 | 4,014,878 |
| 60% | 60.0% | 3,445,990 | 3,444,515 |
| 50% | 50.0% | 2,871,659 | 2,873,930 |
| 40% | 40.1% | 2,297,327 | 2,301,296 |
| 30% | 30.0% | 1,722,995 | 1,725,095 |
| 20% | 19.9% | 1,148,663 | 1,143,972 |
| 10% | 10.0% | 574,332 | 573,833 |
| Active Idle | 0 | 0 | |
| Set Identifier: | SUT |
| Set Description: | System Under Test |
| # of Identical Nodes: | 12 |
| Comment: | SUT |
| Hardware | |
|---|---|
| Hardware Vendor: | Hewlett Packard Enterprise |
| Model: | Synergy 480 Gen10 Compute Module |
| Form Factor: | Other |
| CPU Name: | Intel Xeon Platinum 8180 2.50GHz |
| CPU Characteristics: | 28-Core, 2.50 GHz, 38.5 MB L3 Cache |
| CPU Frequency (MHz): | 2500 |
| CPU(s) Enabled: | 56 cores, 2 chips, 28 cores/chip |
| Hardware Threads: | 112 (2 / core) |
| CPU(s) Orderable: | 1,2 chips |
| Primary Cache: | 32 KB I + 32 KB D on chip per core |
| Secondary Cache: | 1 MB I+D on chip per core |
| Tertiary Cache: | 39424 KB I+D on chip per chip |
| Other Cache: | None |
| Memory Amount (GB): | 192 |
| # and size of DIMM: | 12 x 16384 MB |
| Memory Details: | 12 x 16GB 2Rx8 PC4-2666-V ECC; slots 1, 3, 5, 8, 10 and 12 populated on each CPU socket |
| Power Supply Quantity and Rating (W): | None |
| Power Supply Details: | Shared |
| Disk Drive: | 1 x HPE Synergy 480 Gen10 M.2 FIO Adapter Board Kit (873165-B21); 1 x HPE 480GB SATA 6G Read Intensive M.2 2280 SSD (875498-B21) |
| Disk Controller: | 1 x HPE Smart Array S100i SR Gen10 |
| # and type of Network Interface Cards (NICs) Installed: | 1 x HPE Synergy 3820C 10/20Gb 2-port Converged Network Adapter (777430-B21) |
| NICs Enabled in Firmware / OS / Connected: | 2/1/1 |
| Network Speed (Mbit): | 10000 |
| Keyboard: | None |
| Mouse: | None |
| Monitor: | None |
| Optical Drives: | No |
| Other Hardware: | None |
| Software | |
|---|---|
| Power Management: | Enabled (see SUT Notes) |
| Operating System (OS): | Windows Server 2012 R2 Datacenter |
| OS Version: | 6.3 (Build 9600) |
| Filesystem: | NTFS |
| JVM Vendor: | Oracle Corporation |
| JVM Version: | Java HotSpot(TM) 64-Bit Server VM (build 24.80-b11, mixed mode), version 1.7.0_80 |
| JVM Command-line Options: | -server -Xmn19g -Xms21g -Xmx21g -XX:SurvivorRatio=1 -XX:TargetSurvivorRatio=99 -XX:ParallelGCThreads=28 -XX:AllocatePrefetchDistance=256 -XX:AllocatePrefetchLines=4 -XX:LoopUnrollLimit=45 -XX:InitialTenuringThreshold=12 -XX:MaxTenuringThreshold=15 -XX:InlineSmallCode=9000 -XX:MaxInlineSize=270 -XX:FreqInlineSize=6000 -XX:+UseLargePages -XX:+UseParallelOldGC -XX:+AggressiveOpts |
| JVM Affinity: | start /NODE [0,1,2,3] /AFFINITY [0xFFFFFFF] |
| JVM Instances: | 4 |
| JVM Initial Heap (MB): | 21000 |
| JVM Maximum Heap (MB): | 21000 |
| JVM Address Bits: | 64 |
| Boot Firmware Version: | I42 v1.32 (02/01/2018) |
| Management Firmware Version: | 1.15 Aug 17 2017 |
| Workload Version: | SSJ 1.2.10 |
| Director Location: | Controller |
| Other Software: | HPE Composer Version 3.10.07 (HPE OneView) with HPE Synergy Custom SPP Bundle 2017.10.20180323; Microsoft Windows KB4054519, KB4056898 |
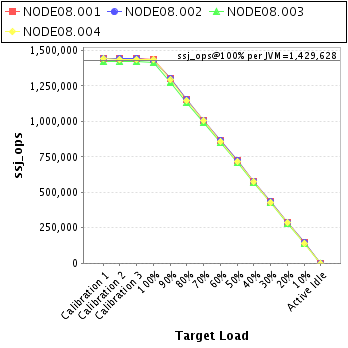
| JVM Instance | ssj_ops@100% |
|---|---|
| NODE08.001 | 1,439,539 |
| NODE08.002 | 1,429,104 |
| NODE08.003 | 1,416,369 |
| NODE08.004 | 1,433,502 |
| ssj_ops@100% | 5,718,513 |
| ssj_ops@100% per JVM | 1,429,628 |
| Target Load | Actual Load | ssj_ops | |
|---|---|---|---|
| Target | Actual | ||
| Calibration 1 | 1,441,024 | ||
| Calibration 2 | 1,441,491 | ||
| Calibration 3 | 1,443,851 | ||
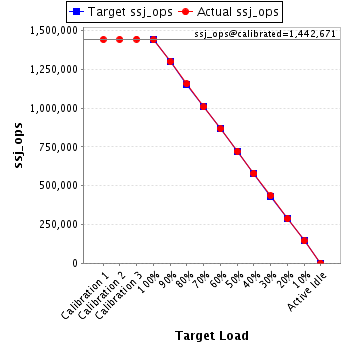
| ssj_ops@calibrated=1,442,671 | |||
| 100% | 99.8% | 1,442,671 | 1,439,539 |
| 90% | 90.0% | 1,298,404 | 1,299,011 |
| 80% | 80.1% | 1,154,137 | 1,155,752 |
| 70% | 69.8% | 1,009,870 | 1,007,046 |
| 60% | 60.0% | 865,603 | 865,777 |
| 50% | 50.0% | 721,335 | 720,932 |
| 40% | 40.1% | 577,068 | 578,068 |
| 30% | 30.1% | 432,801 | 434,218 |
| 20% | 19.9% | 288,534 | 286,837 |
| 10% | 10.0% | 144,267 | 144,127 |
| Active Idle | 0 | 0 | |
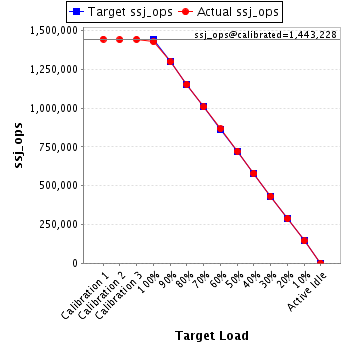
| Target Load | Actual Load | ssj_ops | |
|---|---|---|---|
| Target | Actual | ||
| Calibration 1 | 1,445,597 | ||
| Calibration 2 | 1,442,094 | ||
| Calibration 3 | 1,444,363 | ||
| ssj_ops@calibrated=1,443,228 | |||
| 100% | 99.0% | 1,443,228 | 1,429,104 |
| 90% | 90.1% | 1,298,905 | 1,299,722 |
| 80% | 79.9% | 1,154,583 | 1,153,545 |
| 70% | 69.9% | 1,010,260 | 1,008,169 |
| 60% | 60.1% | 865,937 | 867,184 |
| 50% | 50.1% | 721,614 | 722,749 |
| 40% | 40.1% | 577,291 | 578,713 |
| 30% | 30.0% | 432,968 | 433,133 |
| 20% | 20.0% | 288,646 | 287,933 |
| 10% | 10.0% | 144,323 | 144,717 |
| Active Idle | 0 | 0 | |
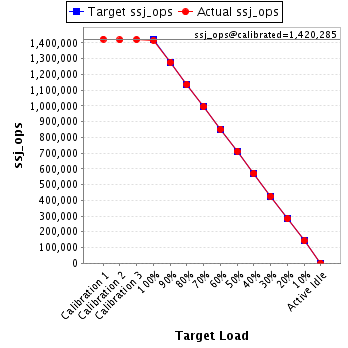
| Target Load | Actual Load | ssj_ops | |
|---|---|---|---|
| Target | Actual | ||
| Calibration 1 | 1,424,050 | ||
| Calibration 2 | 1,419,112 | ||
| Calibration 3 | 1,421,457 | ||
| ssj_ops@calibrated=1,420,285 | |||
| 100% | 99.7% | 1,420,285 | 1,416,369 |
| 90% | 89.9% | 1,278,256 | 1,277,401 |
| 80% | 80.0% | 1,136,228 | 1,135,886 |
| 70% | 70.1% | 994,199 | 995,118 |
| 60% | 60.0% | 852,171 | 852,052 |
| 50% | 50.1% | 710,142 | 711,633 |
| 40% | 40.2% | 568,114 | 570,804 |
| 30% | 30.0% | 426,085 | 426,792 |
| 20% | 19.9% | 284,057 | 283,147 |
| 10% | 10.0% | 142,028 | 142,684 |
| Active Idle | 0 | 0 | |
| Target Load | Actual Load | ssj_ops | |
|---|---|---|---|
| Target | Actual | ||
| Calibration 1 | 1,441,636 | ||
| Calibration 2 | 1,436,290 | ||
| Calibration 3 | 1,437,977 | ||
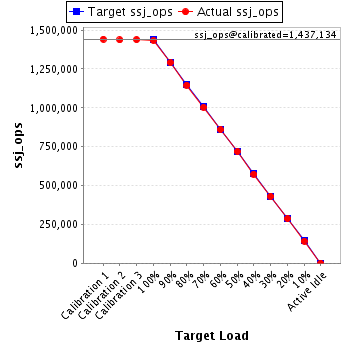
| ssj_ops@calibrated=1,437,134 | |||
| 100% | 99.7% | 1,437,134 | 1,433,502 |
| 90% | 89.9% | 1,293,420 | 1,291,880 |
| 80% | 79.8% | 1,149,707 | 1,146,310 |
| 70% | 69.9% | 1,005,994 | 1,004,544 |
| 60% | 59.8% | 862,280 | 859,503 |
| 50% | 50.0% | 718,567 | 718,616 |
| 40% | 39.9% | 574,853 | 573,710 |
| 30% | 30.0% | 431,140 | 430,952 |
| 20% | 19.9% | 287,427 | 286,055 |
| 10% | 9.9% | 143,713 | 142,304 |
| Active Idle | 0 | 0 | |