SPECpower_ssj2008
Host 'NODE09' Performance Report
Copyright © 2007-2018 Standard Performance Evaluation Corporation
| Hewlett Packard Enterprise Synergy 480 Gen10 Compute Module | ssj_ops@100% = 5,739,970 ssj_ops@100% per JVM = 1,434,993 |
||||
| Test Sponsor: | Hewlett Packard Enterprise | SPEC License #: | 3 | Test Method: | Multi Node |
| Tested By: | Hewlett Packard Enterprise | Test Location: | Houston, TX, USA | Test Date: | Apr 6, 2018 |
| Hardware Availability: | Jun-2018 | Software Availability: | Mar-2018 | Publication: | Apr 25, 2018 |
| System Source: | Single Supplier | System Designation: | Server | Power Provisioning: | Line-powered |
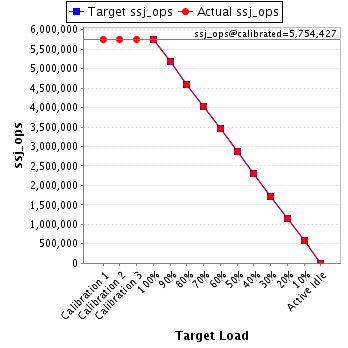
| Target Load | Actual Load | ssj_ops | |
|---|---|---|---|
| Target | Actual | ||
| Calibration 1 | 5,747,390 | ||
| Calibration 2 | 5,751,262 | ||
| Calibration 3 | 5,757,591 | ||
| ssj_ops@calibrated=5,754,427 | |||
| 100% | 99.7% | 5,754,427 | 5,739,970 |
| 90% | 90.1% | 5,178,984 | 5,185,860 |
| 80% | 79.9% | 4,603,541 | 4,597,370 |
| 70% | 70.0% | 4,028,099 | 4,030,259 |
| 60% | 60.0% | 3,452,656 | 3,454,658 |
| 50% | 49.9% | 2,877,213 | 2,872,691 |
| 40% | 39.9% | 2,301,771 | 2,297,989 |
| 30% | 30.0% | 1,726,328 | 1,724,932 |
| 20% | 20.0% | 1,150,885 | 1,152,136 |
| 10% | 10.0% | 575,443 | 576,728 |
| Active Idle | 0 | 0 | |
| Set Identifier: | SUT |
| Set Description: | System Under Test |
| # of Identical Nodes: | 12 |
| Comment: | SUT |
| Hardware | |
|---|---|
| Hardware Vendor: | Hewlett Packard Enterprise |
| Model: | Synergy 480 Gen10 Compute Module |
| Form Factor: | Other |
| CPU Name: | Intel Xeon Platinum 8180 2.50GHz |
| CPU Characteristics: | 28-Core, 2.50 GHz, 38.5 MB L3 Cache |
| CPU Frequency (MHz): | 2500 |
| CPU(s) Enabled: | 56 cores, 2 chips, 28 cores/chip |
| Hardware Threads: | 112 (2 / core) |
| CPU(s) Orderable: | 1,2 chips |
| Primary Cache: | 32 KB I + 32 KB D on chip per core |
| Secondary Cache: | 1 MB I+D on chip per core |
| Tertiary Cache: | 39424 KB I+D on chip per chip |
| Other Cache: | None |
| Memory Amount (GB): | 192 |
| # and size of DIMM: | 12 x 16384 MB |
| Memory Details: | 12 x 16GB 2Rx8 PC4-2666-V ECC; slots 1, 3, 5, 8, 10 and 12 populated on each CPU socket |
| Power Supply Quantity and Rating (W): | None |
| Power Supply Details: | Shared |
| Disk Drive: | 1 x HPE Synergy 480 Gen10 M.2 FIO Adapter Board Kit (873165-B21); 1 x HPE 480GB SATA 6G Read Intensive M.2 2280 SSD (875498-B21) |
| Disk Controller: | 1 x HPE Smart Array S100i SR Gen10 |
| # and type of Network Interface Cards (NICs) Installed: | 1 x HPE Synergy 3820C 10/20Gb 2-port Converged Network Adapter (777430-B21) |
| NICs Enabled in Firmware / OS / Connected: | 2/1/1 |
| Network Speed (Mbit): | 10000 |
| Keyboard: | None |
| Mouse: | None |
| Monitor: | None |
| Optical Drives: | No |
| Other Hardware: | None |
| Software | |
|---|---|
| Power Management: | Enabled (see SUT Notes) |
| Operating System (OS): | Windows Server 2012 R2 Datacenter |
| OS Version: | 6.3 (Build 9600) |
| Filesystem: | NTFS |
| JVM Vendor: | Oracle Corporation |
| JVM Version: | Java HotSpot(TM) 64-Bit Server VM (build 24.80-b11, mixed mode), version 1.7.0_80 |
| JVM Command-line Options: | -server -Xmn19g -Xms21g -Xmx21g -XX:SurvivorRatio=1 -XX:TargetSurvivorRatio=99 -XX:ParallelGCThreads=28 -XX:AllocatePrefetchDistance=256 -XX:AllocatePrefetchLines=4 -XX:LoopUnrollLimit=45 -XX:InitialTenuringThreshold=12 -XX:MaxTenuringThreshold=15 -XX:InlineSmallCode=9000 -XX:MaxInlineSize=270 -XX:FreqInlineSize=6000 -XX:+UseLargePages -XX:+UseParallelOldGC -XX:+AggressiveOpts |
| JVM Affinity: | start /NODE [0,1,2,3] /AFFINITY [0xFFFFFFF] |
| JVM Instances: | 4 |
| JVM Initial Heap (MB): | 21000 |
| JVM Maximum Heap (MB): | 21000 |
| JVM Address Bits: | 64 |
| Boot Firmware Version: | I42 v1.32 (02/01/2018) |
| Management Firmware Version: | 1.15 Aug 17 2017 |
| Workload Version: | SSJ 1.2.10 |
| Director Location: | Controller |
| Other Software: | HPE Composer Version 3.10.07 (HPE OneView) with HPE Synergy Custom SPP Bundle 2017.10.20180323; Microsoft Windows KB4054519, KB4056898 |
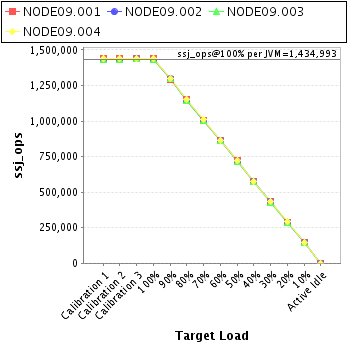
| JVM Instance | ssj_ops@100% |
|---|---|
| NODE09.001 | 1,437,802 |
| NODE09.002 | 1,432,338 |
| NODE09.003 | 1,431,314 |
| NODE09.004 | 1,438,516 |
| ssj_ops@100% | 5,739,970 |
| ssj_ops@100% per JVM | 1,434,993 |
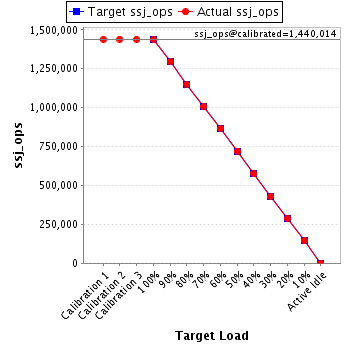
| Target Load | Actual Load | ssj_ops | |
|---|---|---|---|
| Target | Actual | ||
| Calibration 1 | 1,439,427 | ||
| Calibration 2 | 1,440,365 | ||
| Calibration 3 | 1,439,662 | ||
| ssj_ops@calibrated=1,440,014 | |||
| 100% | 99.8% | 1,440,014 | 1,437,802 |
| 90% | 89.9% | 1,296,012 | 1,294,749 |
| 80% | 79.9% | 1,152,011 | 1,150,707 |
| 70% | 69.9% | 1,008,009 | 1,006,473 |
| 60% | 60.1% | 864,008 | 865,160 |
| 50% | 50.0% | 720,007 | 719,661 |
| 40% | 39.9% | 576,005 | 574,189 |
| 30% | 30.0% | 432,004 | 431,337 |
| 20% | 20.0% | 288,003 | 288,231 |
| 10% | 10.1% | 144,001 | 145,106 |
| Active Idle | 0 | 0 | |
| Target Load | Actual Load | ssj_ops | |
|---|---|---|---|
| Target | Actual | ||
| Calibration 1 | 1,433,432 | ||
| Calibration 2 | 1,435,543 | ||
| Calibration 3 | 1,437,487 | ||
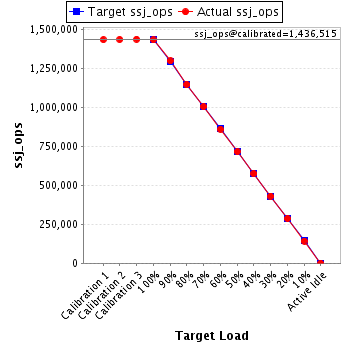
| ssj_ops@calibrated=1,436,515 | |||
| 100% | 99.7% | 1,436,515 | 1,432,338 |
| 90% | 90.4% | 1,292,864 | 1,298,078 |
| 80% | 79.8% | 1,149,212 | 1,146,493 |
| 70% | 69.9% | 1,005,561 | 1,004,707 |
| 60% | 59.9% | 861,909 | 860,771 |
| 50% | 49.8% | 718,258 | 715,698 |
| 40% | 39.9% | 574,606 | 573,797 |
| 30% | 30.0% | 430,955 | 431,310 |
| 20% | 19.9% | 287,303 | 286,322 |
| 10% | 9.9% | 143,652 | 142,771 |
| Active Idle | 0 | 0 | |
| Target Load | Actual Load | ssj_ops | |
|---|---|---|---|
| Target | Actual | ||
| Calibration 1 | 1,434,256 | ||
| Calibration 2 | 1,434,597 | ||
| Calibration 3 | 1,438,586 | ||
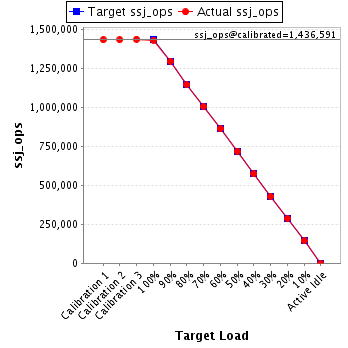
| ssj_ops@calibrated=1,436,591 | |||
| 100% | 99.6% | 1,436,591 | 1,431,314 |
| 90% | 90.3% | 1,292,932 | 1,296,767 |
| 80% | 79.8% | 1,149,273 | 1,145,830 |
| 70% | 70.0% | 1,005,614 | 1,006,324 |
| 60% | 60.0% | 861,955 | 862,457 |
| 50% | 50.0% | 718,296 | 718,104 |
| 40% | 39.9% | 574,637 | 573,097 |
| 30% | 29.9% | 430,977 | 429,192 |
| 20% | 20.0% | 287,318 | 287,161 |
| 10% | 10.0% | 143,659 | 143,578 |
| Active Idle | 0 | 0 | |
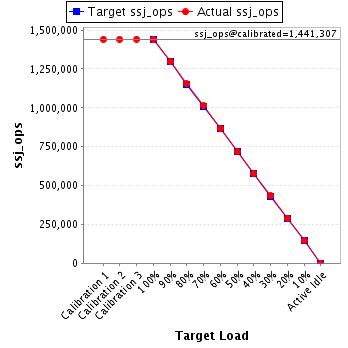
| Target Load | Actual Load | ssj_ops | |
|---|---|---|---|
| Target | Actual | ||
| Calibration 1 | 1,440,275 | ||
| Calibration 2 | 1,440,757 | ||
| Calibration 3 | 1,441,856 | ||
| ssj_ops@calibrated=1,441,307 | |||
| 100% | 99.8% | 1,441,307 | 1,438,516 |
| 90% | 89.9% | 1,297,176 | 1,296,266 |
| 80% | 80.1% | 1,153,045 | 1,154,340 |
| 70% | 70.3% | 1,008,915 | 1,012,754 |
| 60% | 60.1% | 864,784 | 866,270 |
| 50% | 49.9% | 720,653 | 719,227 |
| 40% | 40.0% | 576,523 | 576,906 |
| 30% | 30.0% | 432,392 | 433,092 |
| 20% | 20.1% | 288,261 | 290,423 |
| 10% | 10.1% | 144,131 | 145,272 |
| Active Idle | 0 | 0 | |