SPECpower_ssj2008
Host 'NODE05' Performance Report
Copyright © 2007-2018 Standard Performance Evaluation Corporation
| Hewlett Packard Enterprise Synergy 480 Gen10 Compute Module | ssj_ops@100% = 5,732,798 ssj_ops@100% per JVM = 1,433,200 |
||||
| Test Sponsor: | Hewlett Packard Enterprise | SPEC License #: | 3 | Test Method: | Multi Node |
| Tested By: | Hewlett Packard Enterprise | Test Location: | Houston, TX, USA | Test Date: | Aug 26, 2018 |
| Hardware Availability: | Jun-2018 | Software Availability: | Mar-2018 | Publication: | Sep 12, 2018 |
| System Source: | Single Supplier | System Designation: | Server | Power Provisioning: | Line-powered |
| Target Load | Actual Load | ssj_ops | |
|---|---|---|---|
| Target | Actual | ||
| Calibration 1 | 5,753,221 | ||
| Calibration 2 | 5,752,410 | ||
| Calibration 3 | 5,763,914 | ||
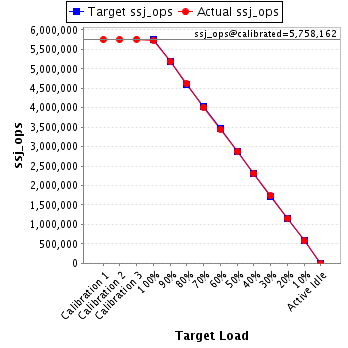
| ssj_ops@calibrated=5,758,162 | |||
| 100% | 99.6% | 5,758,162 | 5,732,798 |
| 90% | 90.1% | 5,182,346 | 5,190,272 |
| 80% | 80.2% | 4,606,530 | 4,616,498 |
| 70% | 69.7% | 4,030,713 | 4,012,898 |
| 60% | 59.9% | 3,454,897 | 3,450,335 |
| 50% | 50.0% | 2,879,081 | 2,878,184 |
| 40% | 40.1% | 2,303,265 | 2,306,208 |
| 30% | 30.1% | 1,727,449 | 1,731,234 |
| 20% | 19.9% | 1,151,632 | 1,148,033 |
| 10% | 10.0% | 575,816 | 576,401 |
| Active Idle | 0 | 0 | |
| Set Identifier: | SUT |
| Set Description: | System Under Test |
| # of Identical Nodes: | 11 |
| Comment: | SUT |
| Hardware | |
|---|---|
| Hardware Vendor: | Hewlett Packard Enterprise |
| Model: | Synergy 480 Gen10 Compute Module |
| Form Factor: | Other |
| CPU Name: | Intel Xeon Platinum 8180 2.50GHz |
| CPU Characteristics: | 28-Core, 2.50 GHz, 38.5 MB L3 Cache |
| CPU Frequency (MHz): | 2500 |
| CPU(s) Enabled: | 56 cores, 2 chips, 28 cores/chip |
| Hardware Threads: | 112 (2 / core) |
| CPU(s) Orderable: | 1,2 chips |
| Primary Cache: | 32 KB I + 32 KB D on chip per core |
| Secondary Cache: | 1 MB I+D on chip per core |
| Tertiary Cache: | 39424 KB I+D on chip per chip |
| Other Cache: | None |
| Memory Amount (GB): | 192 |
| # and size of DIMM: | 12 x 16384 MB |
| Memory Details: | 12 x 16GB 2Rx8 PC4-2666-V ECC; slots 1, 3, 5, 8, 10 and 12 populated on each CPU socket |
| Power Supply Quantity and Rating (W): | None |
| Power Supply Details: | Shared |
| Disk Drive: | 1 x HPE Synergy 480 Gen10 M.2 FIO Adapter Board Kit (873165-B21); 1 x HPE 480GB SATA 6G Read Intensive M.2 2280 SSD (875498-B21) |
| Disk Controller: | 1 x HPE Smart Array S100i SR Gen10 |
| # and type of Network Interface Cards (NICs) Installed: | 1 x HPE Synergy 3820C 10/20Gb 2-port Converged Network Adapter (777430-B21) |
| NICs Enabled in Firmware / OS / Connected: | 2/1/1 |
| Network Speed (Mbit): | 10000 |
| Keyboard: | None |
| Mouse: | None |
| Monitor: | None |
| Optical Drives: | No |
| Other Hardware: | None |
| Software | |
|---|---|
| Power Management: | Enabled (see SUT Notes) |
| Operating System (OS): | Windows Server 2012 R2 Datacenter |
| OS Version: | 6.3 (Build 9600) |
| Filesystem: | NTFS |
| JVM Vendor: | Oracle Corporation |
| JVM Version: | Java HotSpot(TM) 64-Bit Server VM (build 24.80-b11, mixed mode), version 1.7.0_80 |
| JVM Command-line Options: | -server -Xmn19g -Xms21g -Xmx21g -XX:SurvivorRatio=1 -XX:TargetSurvivorRatio=99 -XX:ParallelGCThreads=28 -XX:AllocatePrefetchDistance=256 -XX:AllocatePrefetchLines=4 -XX:LoopUnrollLimit=45 -XX:InitialTenuringThreshold=12 -XX:MaxTenuringThreshold=15 -XX:InlineSmallCode=9000 -XX:MaxInlineSize=270 -XX:FreqInlineSize=6000 -XX:+UseLargePages -XX:+UseParallelOldGC -XX:+AggressiveOpts |
| JVM Affinity: | start /NODE [0,1,2,3] /AFFINITY [0xFFFFFFF] |
| JVM Instances: | 4 |
| JVM Initial Heap (MB): | 21000 |
| JVM Maximum Heap (MB): | 21000 |
| JVM Address Bits: | 64 |
| Boot Firmware Version: | I42 v1.32 (02/01/2018) |
| Management Firmware Version: | 1.15 Aug 17 2017 |
| Workload Version: | SSJ 1.2.10 |
| Director Location: | Controller |
| Other Software: | HPE Composer Version 3.10.07 (HPE OneView) with HPE Synergy Custom SPP Bundle 2017.10.20180323; Microsoft Windows KB4054519, KB4056898 |
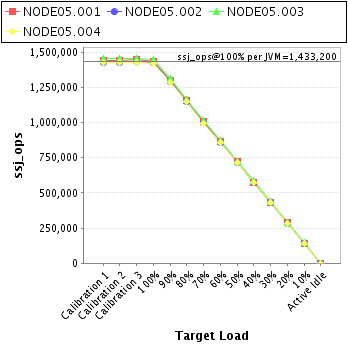
| JVM Instance | ssj_ops@100% |
|---|---|
| NODE05.001 | 1,437,539 |
| NODE05.002 | 1,424,339 |
| NODE05.003 | 1,450,586 |
| NODE05.004 | 1,420,333 |
| ssj_ops@100% | 5,732,798 |
| ssj_ops@100% per JVM | 1,433,200 |
| Target Load | Actual Load | ssj_ops | |
|---|---|---|---|
| Target | Actual | ||
| Calibration 1 | 1,443,841 | ||
| Calibration 2 | 1,443,855 | ||
| Calibration 3 | 1,444,919 | ||
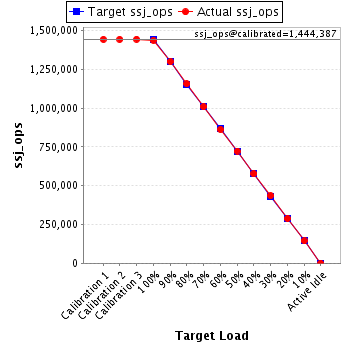
| ssj_ops@calibrated=1,444,387 | |||
| 100% | 99.5% | 1,444,387 | 1,437,539 |
| 90% | 90.0% | 1,299,948 | 1,300,442 |
| 80% | 80.1% | 1,155,510 | 1,157,244 |
| 70% | 69.9% | 1,011,071 | 1,009,016 |
| 60% | 59.7% | 866,632 | 862,840 |
| 50% | 50.1% | 722,193 | 723,811 |
| 40% | 39.9% | 577,755 | 576,441 |
| 30% | 30.1% | 433,316 | 435,109 |
| 20% | 19.9% | 288,877 | 287,429 |
| 10% | 10.0% | 144,439 | 143,992 |
| Active Idle | 0 | 0 | |
| Target Load | Actual Load | ssj_ops | |
|---|---|---|---|
| Target | Actual | ||
| Calibration 1 | 1,427,262 | ||
| Calibration 2 | 1,426,054 | ||
| Calibration 3 | 1,431,032 | ||
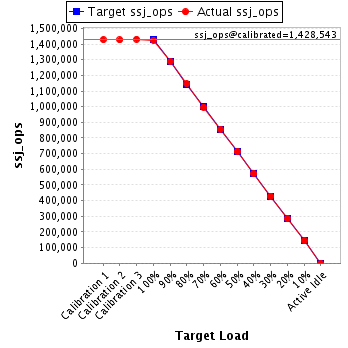
| ssj_ops@calibrated=1,428,543 | |||
| 100% | 99.7% | 1,428,543 | 1,424,339 |
| 90% | 90.2% | 1,285,688 | 1,288,649 |
| 80% | 80.2% | 1,142,834 | 1,146,362 |
| 70% | 69.8% | 999,980 | 997,744 |
| 60% | 60.0% | 857,126 | 857,249 |
| 50% | 50.0% | 714,271 | 714,126 |
| 40% | 40.1% | 571,417 | 572,422 |
| 30% | 30.1% | 428,563 | 429,523 |
| 20% | 20.0% | 285,709 | 285,600 |
| 10% | 10.0% | 142,854 | 143,394 |
| Active Idle | 0 | 0 | |
| Target Load | Actual Load | ssj_ops | |
|---|---|---|---|
| Target | Actual | ||
| Calibration 1 | 1,455,967 | ||
| Calibration 2 | 1,455,294 | ||
| Calibration 3 | 1,457,648 | ||
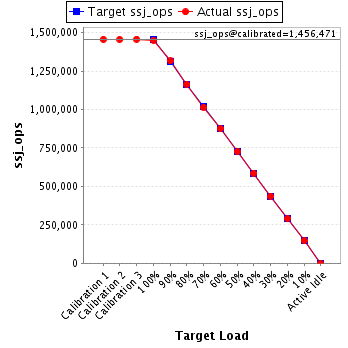
| ssj_ops@calibrated=1,456,471 | |||
| 100% | 99.6% | 1,456,471 | 1,450,586 |
| 90% | 90.3% | 1,310,824 | 1,315,801 |
| 80% | 80.0% | 1,165,177 | 1,165,003 |
| 70% | 69.7% | 1,019,530 | 1,015,291 |
| 60% | 60.1% | 873,883 | 874,611 |
| 50% | 49.8% | 728,235 | 726,039 |
| 40% | 40.2% | 582,588 | 585,565 |
| 30% | 30.0% | 436,941 | 437,219 |
| 20% | 19.9% | 291,294 | 289,535 |
| 10% | 10.1% | 145,647 | 146,378 |
| Active Idle | 0 | 0 | |
| Target Load | Actual Load | ssj_ops | |
|---|---|---|---|
| Target | Actual | ||
| Calibration 1 | 1,426,150 | ||
| Calibration 2 | 1,427,207 | ||
| Calibration 3 | 1,430,316 | ||
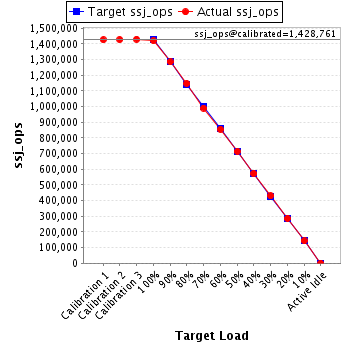
| ssj_ops@calibrated=1,428,761 | |||
| 100% | 99.4% | 1,428,761 | 1,420,333 |
| 90% | 90.0% | 1,285,885 | 1,285,380 |
| 80% | 80.3% | 1,143,009 | 1,147,888 |
| 70% | 69.4% | 1,000,133 | 990,847 |
| 60% | 59.9% | 857,257 | 855,635 |
| 50% | 50.0% | 714,381 | 714,208 |
| 40% | 40.0% | 571,505 | 571,780 |
| 30% | 30.1% | 428,628 | 429,384 |
| 20% | 20.0% | 285,752 | 285,469 |
| 10% | 10.0% | 142,876 | 142,637 |
| Active Idle | 0 | 0 | |