SPECpower_ssj2008
Host 'WIN-SUT102' Performance Report
Copyright © 2007-2019 Standard Performance Evaluation Corporation
| New H3C Technologies Co., Ltd. H3C UniServer B5700 G3 | ssj_ops@100% = 5,686,032 ssj_ops@100% per JVM = 1,421,508 |
||||
| Test Sponsor: | New H3C Technologies Co., Ltd. | SPEC License #: | 9066 | Test Method: | Multi Node |
| Tested By: | New H3C Technologies Co., Ltd. | Test Location: | Hangzhou, Zhejiang, China | Test Date: | May 23, 2019 |
| Hardware Availability: | Jan-2019 | Software Availability: | Jan-2019 | Publication: | Jun 26, 2019 |
| System Source: | Single Supplier | System Designation: | Server | Power Provisioning: | Line-powered |
| Target Load | Actual Load | ssj_ops | |
|---|---|---|---|
| Target | Actual | ||
| Calibration 1 | 5,708,817 | ||
| Calibration 2 | 5,703,681 | ||
| Calibration 3 | 5,714,864 | ||
| ssj_ops@calibrated=5,709,272 | |||
| 100% | 99.6% | 5,709,272 | 5,686,032 |
| 90% | 90.0% | 5,138,345 | 5,137,299 |
| 80% | 80.1% | 4,567,418 | 4,573,540 |
| 70% | 69.9% | 3,996,491 | 3,990,417 |
| 60% | 59.9% | 3,425,563 | 3,420,835 |
| 50% | 50.0% | 2,854,636 | 2,853,530 |
| 40% | 39.9% | 2,283,709 | 2,278,467 |
| 30% | 30.0% | 1,712,782 | 1,711,056 |
| 20% | 19.9% | 1,141,854 | 1,137,679 |
| 10% | 10.0% | 570,927 | 572,270 |
| Active Idle | 0 | 0 | |

| Set Identifier: | sut |
| Set Description: | System Under Test |
| # of Identical Nodes: | 15 |
| Comment: | SUT |
| Hardware | |
|---|---|
| Hardware Vendor: | New H3C Technologies Co., Ltd. |
| Model: | H3C UniServer B5700 G3 |
| Form Factor: | other |
| CPU Name: | Intel Xeon Platinum 8180 2.50GHz |
| CPU Characteristics: | 28-Core, 2.50 GHz, 38.5 MB L3 Cache |
| CPU Frequency (MHz): | 2500 |
| CPU(s) Enabled: | 56 cores, 2 chips, 28 cores/chip |
| Hardware Threads: | 112 (2 / core) |
| CPU(s) Orderable: | 1,2 chips |
| Primary Cache: | 32 KB I + 32 KB D on chip per core |
| Secondary Cache: | 1 MB I+D on chip per core |
| Tertiary Cache: | 39424 KB I+D on chip per chip |
| Other Cache: | None |
| Memory Amount (GB): | 192.0 |
| # and size of DIMM: | 12 x 16384 MB |
| Memory Details: | 12 x 16GB 2Rx8 PC4-2666-V ECC;slots A1, A2, A3, A4, A5, A6, B1, B2, B3, B4, B5, B6 populated |
| Power Supply Quantity and Rating (W): | None |
| Power Supply Details: | Shared |
| Disk Drive: | SATA DOM 128GB P/N DESSH-A28D09BCADCA |
| Disk Controller: | Integrated SATA controller |
| # and type of Network Interface Cards (NICs) Installed: | 1 x Intel I350 Gigabit Ethernet Controller |
| NICs Enabled in Firmware / OS / Connected: | 2/2/1 |
| Network Speed (Mbit): | 1000 |
| Keyboard: | None |
| Mouse: | None |
| Monitor: | None |
| Optical Drives: | No |
| Other Hardware: | None |
| Software | |
|---|---|
| Power Management: | Balanced Mode enabled in OS (see SUT Notes) |
| Operating System (OS): | Microsoft Windows Server 2012 R2 Datacenter |
| OS Version: | Version 6.3 (Build 9600) |
| Filesystem: | NTFS |
| JVM Vendor: | Oracle Corporation |
| JVM Version: | Java HotSpot(TM) 64-Bit Server VM (build 24.80-b11, mixed mode), version 1.7.0_80 |
| JVM Command-line Options: | -server -Xmn19g -Xms21g -Xmx21g -XX:SurvivorRatio=1 -XX:TargetSurvivorRatio=99 -XX:ParallelGCThreads=28 -XX:AllocatePrefetchDistance=256 -XX:AllocatePrefetchLines=4 -XX:LoopUnrollLimit=45 -XX:InitialTenuringThreshold=12 -XX:MaxTenuringThreshold=15 -XX:InlineSmallCode=9000 -XX:MaxInlineSize=270 -XX:FreqInlineSize=6000 -XX:+UseLargePages -XX:+UseParallelOldGC -XX:+AggressiveOpts |
| JVM Affinity: | start /NODE [0,2] /AFFINITY [0xFC0FF00FC0FF];start /NODE [1,3] /AFFINITY [0xFF03F00FF03F] |
| JVM Instances: | 4 |
| JVM Initial Heap (MB): | 21000 |
| JVM Maximum Heap (MB): | 21000 |
| JVM Address Bits: | 64 |
| Boot Firmware Version: | 2.00.25 |
| Management Firmware Version: | UIS-OM 1.00.10 |
| Workload Version: | SSJ 1.2.10 |
| Director Location: | Controller |
| Other Software: | Microsoft Windows KB3021910, clearcompressionflag.exe, KB2919355, KB2932046, KB2959977, KB2937592, KB2938439, KB2934018, KB4056898, patched to this test system in May 16, 2019 |
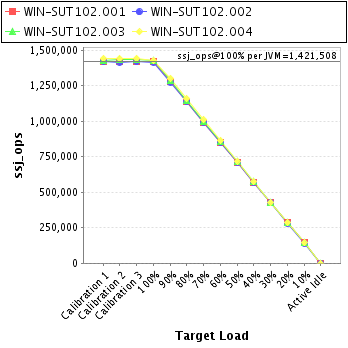
| JVM Instance | ssj_ops@100% |
|---|---|
| WIN-SUT102.001 | 1,418,528 |
| WIN-SUT102.002 | 1,414,783 |
| WIN-SUT102.003 | 1,426,421 |
| WIN-SUT102.004 | 1,426,300 |
| ssj_ops@100% | 5,686,032 |
| ssj_ops@100% per JVM | 1,421,508 |
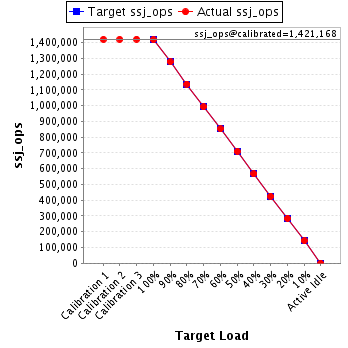
| Target Load | Actual Load | ssj_ops | |
|---|---|---|---|
| Target | Actual | ||
| Calibration 1 | 1,420,345 | ||
| Calibration 2 | 1,420,425 | ||
| Calibration 3 | 1,421,912 | ||
| ssj_ops@calibrated=1,421,168 | |||
| 100% | 99.8% | 1,421,168 | 1,418,528 |
| 90% | 89.9% | 1,279,052 | 1,277,731 |
| 80% | 80.0% | 1,136,935 | 1,137,432 |
| 70% | 69.8% | 994,818 | 992,147 |
| 60% | 60.0% | 852,701 | 852,167 |
| 50% | 50.0% | 710,584 | 710,486 |
| 40% | 39.9% | 568,467 | 566,644 |
| 30% | 29.9% | 426,351 | 425,011 |
| 20% | 20.1% | 284,234 | 285,042 |
| 10% | 10.1% | 142,117 | 143,149 |
| Active Idle | 0 | 0 | |
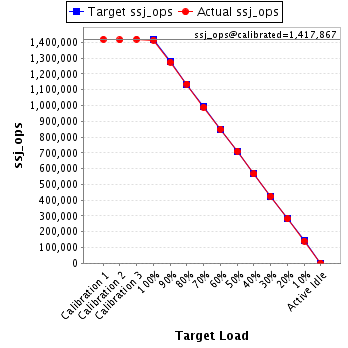
| Target Load | Actual Load | ssj_ops | |
|---|---|---|---|
| Target | Actual | ||
| Calibration 1 | 1,419,086 | ||
| Calibration 2 | 1,415,380 | ||
| Calibration 3 | 1,420,354 | ||
| ssj_ops@calibrated=1,417,867 | |||
| 100% | 99.8% | 1,417,867 | 1,414,783 |
| 90% | 89.9% | 1,276,080 | 1,274,593 |
| 80% | 80.1% | 1,134,294 | 1,136,091 |
| 70% | 69.8% | 992,507 | 989,989 |
| 60% | 60.0% | 850,720 | 850,562 |
| 50% | 50.0% | 708,934 | 709,567 |
| 40% | 39.9% | 567,147 | 566,002 |
| 30% | 30.0% | 425,360 | 425,197 |
| 20% | 19.8% | 283,573 | 281,407 |
| 10% | 9.9% | 141,787 | 140,933 |
| Active Idle | 0 | 0 | |
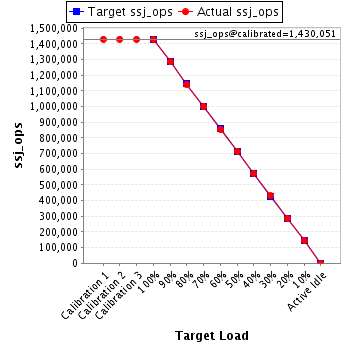
| Target Load | Actual Load | ssj_ops | |
|---|---|---|---|
| Target | Actual | ||
| Calibration 1 | 1,429,537 | ||
| Calibration 2 | 1,430,157 | ||
| Calibration 3 | 1,429,945 | ||
| ssj_ops@calibrated=1,430,051 | |||
| 100% | 99.7% | 1,430,051 | 1,426,421 |
| 90% | 89.8% | 1,287,046 | 1,284,557 |
| 80% | 79.9% | 1,144,041 | 1,143,034 |
| 70% | 70.0% | 1,001,036 | 1,000,389 |
| 60% | 59.9% | 858,030 | 856,530 |
| 50% | 50.0% | 715,025 | 715,412 |
| 40% | 40.0% | 572,020 | 572,452 |
| 30% | 30.1% | 429,015 | 430,062 |
| 20% | 19.9% | 286,010 | 285,217 |
| 10% | 10.1% | 143,005 | 144,098 |
| Active Idle | 0 | 0 | |
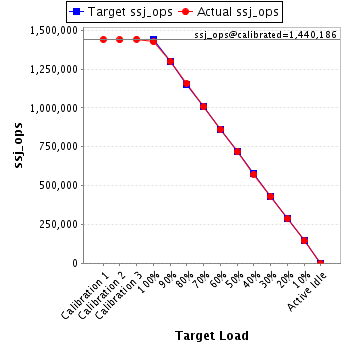
| Target Load | Actual Load | ssj_ops | |
|---|---|---|---|
| Target | Actual | ||
| Calibration 1 | 1,439,849 | ||
| Calibration 2 | 1,437,719 | ||
| Calibration 3 | 1,442,653 | ||
| ssj_ops@calibrated=1,440,186 | |||
| 100% | 99.0% | 1,440,186 | 1,426,300 |
| 90% | 90.3% | 1,296,167 | 1,300,418 |
| 80% | 80.3% | 1,152,149 | 1,156,983 |
| 70% | 70.0% | 1,008,130 | 1,007,893 |
| 60% | 59.8% | 864,112 | 861,576 |
| 50% | 49.9% | 720,093 | 718,066 |
| 40% | 39.8% | 576,074 | 573,369 |
| 30% | 29.9% | 432,056 | 430,787 |
| 20% | 19.9% | 288,037 | 286,013 |
| 10% | 10.0% | 144,019 | 144,090 |
| Active Idle | 0 | 0 | |