SPECpower_ssj2008
Host 'WIN-SUT106' Performance Report
Copyright © 2007-2019 Standard Performance Evaluation Corporation
| New H3C Technologies Co., Ltd. H3C UniServer B5700 G3 | ssj_ops@100% = 5,702,943 ssj_ops@100% per JVM = 1,425,736 |
||||
| Test Sponsor: | New H3C Technologies Co., Ltd. | SPEC License #: | 9066 | Test Method: | Multi Node |
| Tested By: | New H3C Technologies Co., Ltd. | Test Location: | Hangzhou, Zhejiang, China | Test Date: | May 23, 2019 |
| Hardware Availability: | Jan-2019 | Software Availability: | Jan-2019 | Publication: | Jun 26, 2019 |
| System Source: | Single Supplier | System Designation: | Server | Power Provisioning: | Line-powered |
| Target Load | Actual Load | ssj_ops | |
|---|---|---|---|
| Target | Actual | ||
| Calibration 1 | 5,706,439 | ||
| Calibration 2 | 5,703,579 | ||
| Calibration 3 | 5,715,792 | ||
| ssj_ops@calibrated=5,709,686 | |||
| 100% | 99.9% | 5,709,686 | 5,702,943 |
| 90% | 90.2% | 5,138,717 | 5,148,067 |
| 80% | 81.0% | 4,567,748 | 4,626,382 |
| 70% | 70.0% | 3,996,780 | 3,994,064 |
| 60% | 60.0% | 3,425,811 | 3,423,393 |
| 50% | 50.0% | 2,854,843 | 2,857,674 |
| 40% | 40.0% | 2,283,874 | 2,284,722 |
| 30% | 29.9% | 1,712,906 | 1,709,290 |
| 20% | 20.0% | 1,141,937 | 1,144,146 |
| 10% | 10.0% | 570,969 | 571,848 |
| Active Idle | 0 | 0 | |

| Set Identifier: | sut |
| Set Description: | System Under Test |
| # of Identical Nodes: | 15 |
| Comment: | SUT |
| Hardware | |
|---|---|
| Hardware Vendor: | New H3C Technologies Co., Ltd. |
| Model: | H3C UniServer B5700 G3 |
| Form Factor: | other |
| CPU Name: | Intel Xeon Platinum 8180 2.50GHz |
| CPU Characteristics: | 28-Core, 2.50 GHz, 38.5 MB L3 Cache |
| CPU Frequency (MHz): | 2500 |
| CPU(s) Enabled: | 56 cores, 2 chips, 28 cores/chip |
| Hardware Threads: | 112 (2 / core) |
| CPU(s) Orderable: | 1,2 chips |
| Primary Cache: | 32 KB I + 32 KB D on chip per core |
| Secondary Cache: | 1 MB I+D on chip per core |
| Tertiary Cache: | 39424 KB I+D on chip per chip |
| Other Cache: | None |
| Memory Amount (GB): | 192.0 |
| # and size of DIMM: | 12 x 16384 MB |
| Memory Details: | 12 x 16GB 2Rx8 PC4-2666-V ECC;slots A1, A2, A3, A4, A5, A6, B1, B2, B3, B4, B5, B6 populated |
| Power Supply Quantity and Rating (W): | None |
| Power Supply Details: | Shared |
| Disk Drive: | SATA DOM 128GB P/N DESSH-A28D09BCADCA |
| Disk Controller: | Integrated SATA controller |
| # and type of Network Interface Cards (NICs) Installed: | 1 x Intel I350 Gigabit Ethernet Controller |
| NICs Enabled in Firmware / OS / Connected: | 2/2/1 |
| Network Speed (Mbit): | 1000 |
| Keyboard: | None |
| Mouse: | None |
| Monitor: | None |
| Optical Drives: | No |
| Other Hardware: | None |
| Software | |
|---|---|
| Power Management: | Balanced Mode enabled in OS (see SUT Notes) |
| Operating System (OS): | Microsoft Windows Server 2012 R2 Datacenter |
| OS Version: | Version 6.3 (Build 9600) |
| Filesystem: | NTFS |
| JVM Vendor: | Oracle Corporation |
| JVM Version: | Java HotSpot(TM) 64-Bit Server VM (build 24.80-b11, mixed mode), version 1.7.0_80 |
| JVM Command-line Options: | -server -Xmn19g -Xms21g -Xmx21g -XX:SurvivorRatio=1 -XX:TargetSurvivorRatio=99 -XX:ParallelGCThreads=28 -XX:AllocatePrefetchDistance=256 -XX:AllocatePrefetchLines=4 -XX:LoopUnrollLimit=45 -XX:InitialTenuringThreshold=12 -XX:MaxTenuringThreshold=15 -XX:InlineSmallCode=9000 -XX:MaxInlineSize=270 -XX:FreqInlineSize=6000 -XX:+UseLargePages -XX:+UseParallelOldGC -XX:+AggressiveOpts |
| JVM Affinity: | start /NODE [0,2] /AFFINITY [0xFC0FF00FC0FF];start /NODE [1,3] /AFFINITY [0xFF03F00FF03F] |
| JVM Instances: | 4 |
| JVM Initial Heap (MB): | 21000 |
| JVM Maximum Heap (MB): | 21000 |
| JVM Address Bits: | 64 |
| Boot Firmware Version: | 2.00.25 |
| Management Firmware Version: | UIS-OM 1.00.10 |
| Workload Version: | SSJ 1.2.10 |
| Director Location: | Controller |
| Other Software: | Microsoft Windows KB3021910, clearcompressionflag.exe, KB2919355, KB2932046, KB2959977, KB2937592, KB2938439, KB2934018, KB4056898, patched to this test system in May 16, 2019 |
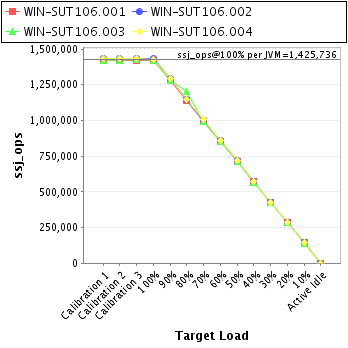
| JVM Instance | ssj_ops@100% |
|---|---|
| WIN-SUT106.001 | 1,422,514 |
| WIN-SUT106.002 | 1,431,344 |
| WIN-SUT106.003 | 1,420,001 |
| WIN-SUT106.004 | 1,429,084 |
| ssj_ops@100% | 5,702,943 |
| ssj_ops@100% per JVM | 1,425,736 |
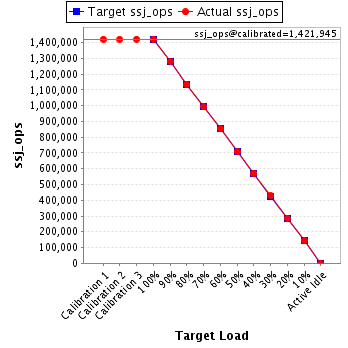
| Target Load | Actual Load | ssj_ops | |
|---|---|---|---|
| Target | Actual | ||
| Calibration 1 | 1,421,607 | ||
| Calibration 2 | 1,421,387 | ||
| Calibration 3 | 1,422,504 | ||
| ssj_ops@calibrated=1,421,945 | |||
| 100% | 100.0% | 1,421,945 | 1,422,514 |
| 90% | 90.1% | 1,279,751 | 1,281,472 |
| 80% | 79.9% | 1,137,556 | 1,136,242 |
| 70% | 69.8% | 995,362 | 992,165 |
| 60% | 60.0% | 853,167 | 853,720 |
| 50% | 49.9% | 710,973 | 709,146 |
| 40% | 40.1% | 568,778 | 569,506 |
| 30% | 30.1% | 426,584 | 428,022 |
| 20% | 20.1% | 284,389 | 285,832 |
| 10% | 10.0% | 142,195 | 142,675 |
| Active Idle | 0 | 0 | |
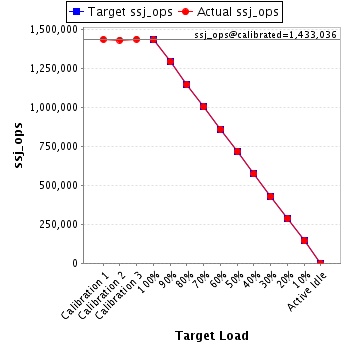
| Target Load | Actual Load | ssj_ops | |
|---|---|---|---|
| Target | Actual | ||
| Calibration 1 | 1,434,198 | ||
| Calibration 2 | 1,430,338 | ||
| Calibration 3 | 1,435,733 | ||
| ssj_ops@calibrated=1,433,036 | |||
| 100% | 99.9% | 1,433,036 | 1,431,344 |
| 90% | 90.1% | 1,289,732 | 1,291,006 |
| 80% | 79.9% | 1,146,429 | 1,144,371 |
| 70% | 69.9% | 1,003,125 | 1,001,170 |
| 60% | 60.0% | 859,821 | 860,134 |
| 50% | 50.1% | 716,518 | 717,397 |
| 40% | 39.9% | 573,214 | 572,242 |
| 30% | 29.9% | 429,911 | 427,980 |
| 20% | 20.0% | 286,607 | 286,168 |
| 10% | 10.0% | 143,304 | 143,555 |
| Active Idle | 0 | 0 | |
| Target Load | Actual Load | ssj_ops | |
|---|---|---|---|
| Target | Actual | ||
| Calibration 1 | 1,420,120 | ||
| Calibration 2 | 1,421,340 | ||
| Calibration 3 | 1,424,107 | ||
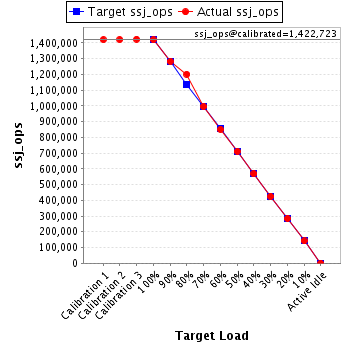
| ssj_ops@calibrated=1,422,723 | |||
| 100% | 99.8% | 1,422,723 | 1,420,001 |
| 90% | 90.2% | 1,280,451 | 1,282,840 |
| 80% | 84.4% | 1,138,179 | 1,201,377 |
| 70% | 70.0% | 995,906 | 995,867 |
| 60% | 59.8% | 853,634 | 850,971 |
| 50% | 50.0% | 711,362 | 711,325 |
| 40% | 39.9% | 569,089 | 567,836 |
| 30% | 29.9% | 426,817 | 425,068 |
| 20% | 19.9% | 284,545 | 283,444 |
| 10% | 10.0% | 142,272 | 141,826 |
| Active Idle | 0 | 0 | |
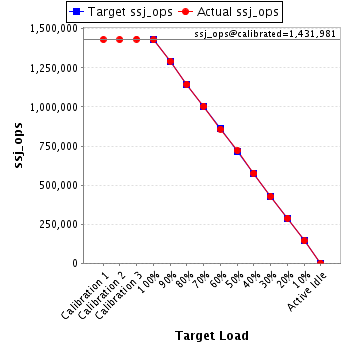
| Target Load | Actual Load | ssj_ops | |
|---|---|---|---|
| Target | Actual | ||
| Calibration 1 | 1,430,513 | ||
| Calibration 2 | 1,430,513 | ||
| Calibration 3 | 1,433,449 | ||
| ssj_ops@calibrated=1,431,981 | |||
| 100% | 99.8% | 1,431,981 | 1,429,084 |
| 90% | 90.3% | 1,288,783 | 1,292,750 |
| 80% | 79.9% | 1,145,585 | 1,144,392 |
| 70% | 70.2% | 1,002,387 | 1,004,861 |
| 60% | 60.0% | 859,189 | 858,569 |
| 50% | 50.3% | 715,991 | 719,806 |
| 40% | 40.2% | 572,792 | 575,138 |
| 30% | 29.9% | 429,594 | 428,220 |
| 20% | 20.2% | 286,396 | 288,702 |
| 10% | 10.0% | 143,198 | 143,793 |
| Active Idle | 0 | 0 | |