SPECpower_ssj2008
Host 'WIN-SUT109' Performance Report
Copyright © 2007-2019 Standard Performance Evaluation Corporation
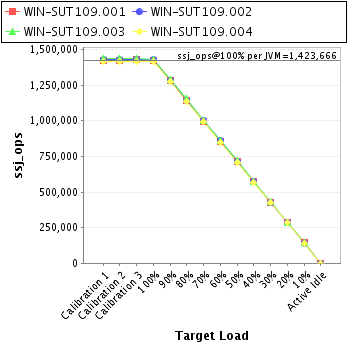
| New H3C Technologies Co., Ltd. H3C UniServer B5700 G3 | ssj_ops@100% = 5,694,665 ssj_ops@100% per JVM = 1,423,666 |
||||
| Test Sponsor: | New H3C Technologies Co., Ltd. | SPEC License #: | 9066 | Test Method: | Multi Node |
| Tested By: | New H3C Technologies Co., Ltd. | Test Location: | Hangzhou, Zhejiang, China | Test Date: | May 23, 2019 |
| Hardware Availability: | Jan-2019 | Software Availability: | Jan-2019 | Publication: | Jun 26, 2019 |
| System Source: | Single Supplier | System Designation: | Server | Power Provisioning: | Line-powered |
| Target Load | Actual Load | ssj_ops | |
|---|---|---|---|
| Target | Actual | ||
| Calibration 1 | 5,706,830 | ||
| Calibration 2 | 5,700,950 | ||
| Calibration 3 | 5,710,714 | ||
| ssj_ops@calibrated=5,705,832 | |||
| 100% | 99.8% | 5,705,832 | 5,694,665 |
| 90% | 90.0% | 5,135,249 | 5,136,163 |
| 80% | 80.0% | 4,564,665 | 4,566,712 |
| 70% | 70.1% | 3,994,082 | 3,997,918 |
| 60% | 60.0% | 3,423,499 | 3,423,741 |
| 50% | 50.0% | 2,852,916 | 2,853,646 |
| 40% | 40.0% | 2,282,333 | 2,283,618 |
| 30% | 30.0% | 1,711,750 | 1,709,437 |
| 20% | 20.0% | 1,141,166 | 1,141,200 |
| 10% | 10.0% | 570,583 | 569,208 |
| Active Idle | 0 | 0 | |

| Set Identifier: | sut |
| Set Description: | System Under Test |
| # of Identical Nodes: | 15 |
| Comment: | SUT |
| Hardware | |
|---|---|
| Hardware Vendor: | New H3C Technologies Co., Ltd. |
| Model: | H3C UniServer B5700 G3 |
| Form Factor: | other |
| CPU Name: | Intel Xeon Platinum 8180 2.50GHz |
| CPU Characteristics: | 28-Core, 2.50 GHz, 38.5 MB L3 Cache |
| CPU Frequency (MHz): | 2500 |
| CPU(s) Enabled: | 56 cores, 2 chips, 28 cores/chip |
| Hardware Threads: | 112 (2 / core) |
| CPU(s) Orderable: | 1,2 chips |
| Primary Cache: | 32 KB I + 32 KB D on chip per core |
| Secondary Cache: | 1 MB I+D on chip per core |
| Tertiary Cache: | 39424 KB I+D on chip per chip |
| Other Cache: | None |
| Memory Amount (GB): | 192.0 |
| # and size of DIMM: | 12 x 16384 MB |
| Memory Details: | 12 x 16GB 2Rx8 PC4-2666-V ECC;slots A1, A2, A3, A4, A5, A6, B1, B2, B3, B4, B5, B6 populated |
| Power Supply Quantity and Rating (W): | None |
| Power Supply Details: | Shared |
| Disk Drive: | SATA DOM 128GB P/N DESSH-A28D09BCADCA |
| Disk Controller: | Integrated SATA controller |
| # and type of Network Interface Cards (NICs) Installed: | 1 x Intel I350 Gigabit Ethernet Controller |
| NICs Enabled in Firmware / OS / Connected: | 2/2/1 |
| Network Speed (Mbit): | 1000 |
| Keyboard: | None |
| Mouse: | None |
| Monitor: | None |
| Optical Drives: | No |
| Other Hardware: | None |
| Software | |
|---|---|
| Power Management: | Balanced Mode enabled in OS (see SUT Notes) |
| Operating System (OS): | Microsoft Windows Server 2012 R2 Datacenter |
| OS Version: | Version 6.3 (Build 9600) |
| Filesystem: | NTFS |
| JVM Vendor: | Oracle Corporation |
| JVM Version: | Java HotSpot(TM) 64-Bit Server VM (build 24.80-b11, mixed mode), version 1.7.0_80 |
| JVM Command-line Options: | -server -Xmn19g -Xms21g -Xmx21g -XX:SurvivorRatio=1 -XX:TargetSurvivorRatio=99 -XX:ParallelGCThreads=28 -XX:AllocatePrefetchDistance=256 -XX:AllocatePrefetchLines=4 -XX:LoopUnrollLimit=45 -XX:InitialTenuringThreshold=12 -XX:MaxTenuringThreshold=15 -XX:InlineSmallCode=9000 -XX:MaxInlineSize=270 -XX:FreqInlineSize=6000 -XX:+UseLargePages -XX:+UseParallelOldGC -XX:+AggressiveOpts |
| JVM Affinity: | start /NODE [0,2] /AFFINITY [0xFC0FF00FC0FF];start /NODE [1,3] /AFFINITY [0xFF03F00FF03F] |
| JVM Instances: | 4 |
| JVM Initial Heap (MB): | 21000 |
| JVM Maximum Heap (MB): | 21000 |
| JVM Address Bits: | 64 |
| Boot Firmware Version: | 2.00.25 |
| Management Firmware Version: | UIS-OM 1.00.10 |
| Workload Version: | SSJ 1.2.10 |
| Director Location: | Controller |
| Other Software: | Microsoft Windows KB3021910, clearcompressionflag.exe, KB2919355, KB2932046, KB2959977, KB2937592, KB2938439, KB2934018, KB4056898, patched to this test system in May 16, 2019 |
| JVM Instance | ssj_ops@100% |
|---|---|
| WIN-SUT109.001 | 1,420,549 |
| WIN-SUT109.002 | 1,427,178 |
| WIN-SUT109.003 | 1,433,925 |
| WIN-SUT109.004 | 1,413,012 |
| ssj_ops@100% | 5,694,665 |
| ssj_ops@100% per JVM | 1,423,666 |
| Target Load | Actual Load | ssj_ops | |
|---|---|---|---|
| Target | Actual | ||
| Calibration 1 | 1,422,752 | ||
| Calibration 2 | 1,421,803 | ||
| Calibration 3 | 1,426,924 | ||
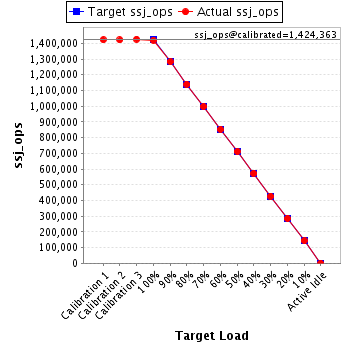
| ssj_ops@calibrated=1,424,363 | |||
| 100% | 99.7% | 1,424,363 | 1,420,549 |
| 90% | 90.1% | 1,281,927 | 1,283,018 |
| 80% | 80.0% | 1,139,491 | 1,139,492 |
| 70% | 70.1% | 997,054 | 998,432 |
| 60% | 59.9% | 854,618 | 853,373 |
| 50% | 50.0% | 712,182 | 712,026 |
| 40% | 40.1% | 569,745 | 571,511 |
| 30% | 30.0% | 427,309 | 427,345 |
| 20% | 20.0% | 284,873 | 284,812 |
| 10% | 10.0% | 142,436 | 143,005 |
| Active Idle | 0 | 0 | |
| Target Load | Actual Load | ssj_ops | |
|---|---|---|---|
| Target | Actual | ||
| Calibration 1 | 1,429,602 | ||
| Calibration 2 | 1,427,926 | ||
| Calibration 3 | 1,429,089 | ||
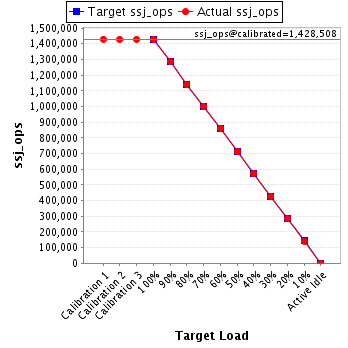
| ssj_ops@calibrated=1,428,508 | |||
| 100% | 99.9% | 1,428,508 | 1,427,178 |
| 90% | 90.0% | 1,285,657 | 1,285,434 |
| 80% | 79.8% | 1,142,806 | 1,139,417 |
| 70% | 70.2% | 999,955 | 1,002,751 |
| 60% | 60.3% | 857,105 | 861,534 |
| 50% | 50.1% | 714,254 | 715,107 |
| 40% | 40.0% | 571,403 | 571,929 |
| 30% | 29.8% | 428,552 | 425,368 |
| 20% | 20.0% | 285,702 | 285,200 |
| 10% | 9.9% | 142,851 | 141,600 |
| Active Idle | 0 | 0 | |
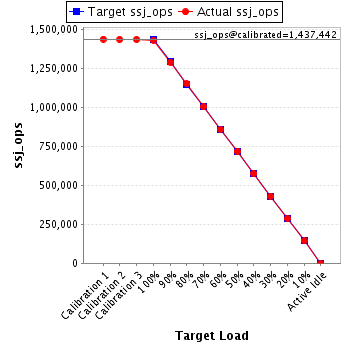
| Target Load | Actual Load | ssj_ops | |
|---|---|---|---|
| Target | Actual | ||
| Calibration 1 | 1,439,683 | ||
| Calibration 2 | 1,437,463 | ||
| Calibration 3 | 1,437,421 | ||
| ssj_ops@calibrated=1,437,442 | |||
| 100% | 99.8% | 1,437,442 | 1,433,925 |
| 90% | 89.9% | 1,293,698 | 1,292,565 |
| 80% | 80.2% | 1,149,954 | 1,153,408 |
| 70% | 69.9% | 1,006,210 | 1,004,731 |
| 60% | 59.9% | 862,465 | 860,497 |
| 50% | 50.0% | 718,721 | 718,253 |
| 40% | 40.0% | 574,977 | 575,665 |
| 30% | 30.0% | 431,233 | 431,880 |
| 20% | 20.1% | 287,488 | 288,252 |
| 10% | 10.0% | 143,744 | 144,200 |
| Active Idle | 0 | 0 | |
| Target Load | Actual Load | ssj_ops | |
|---|---|---|---|
| Target | Actual | ||
| Calibration 1 | 1,414,792 | ||
| Calibration 2 | 1,413,758 | ||
| Calibration 3 | 1,417,280 | ||
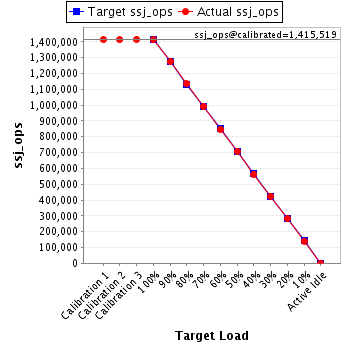
| ssj_ops@calibrated=1,415,519 | |||
| 100% | 99.8% | 1,415,519 | 1,413,012 |
| 90% | 90.1% | 1,273,967 | 1,275,146 |
| 80% | 80.1% | 1,132,415 | 1,134,395 |
| 70% | 70.1% | 990,863 | 992,004 |
| 60% | 59.9% | 849,311 | 848,337 |
| 50% | 50.0% | 707,759 | 708,260 |
| 40% | 39.9% | 566,207 | 564,512 |
| 30% | 30.0% | 424,656 | 424,844 |
| 20% | 20.0% | 283,104 | 282,936 |
| 10% | 9.9% | 141,552 | 140,402 |
| Active Idle | 0 | 0 | |