SPEC virt_sc ® 2013 Design Overview

Version 1.1 - September 21, 2016


1.0 Overview of SPEC virt_sc

SPEC virt_sc ® 2013 is designed to be a standard method for measuring a virtualization platform's ability to manage a server consolidation scenario in the datacenter and for comparing performance between virtualized environments. It is intended to measure the performance of the hardware, software, and application layers in a virtualized environment. This includes both hardware and virtualization software and is intended to be run by hardware vendors, virtualization software vendors, application software vendors, academic researchers,and datacenter managers. The benchmark is designed to scale across a wide range of systems and is comprised of a set of component workloads representing common application categories typical of virtualized environments.

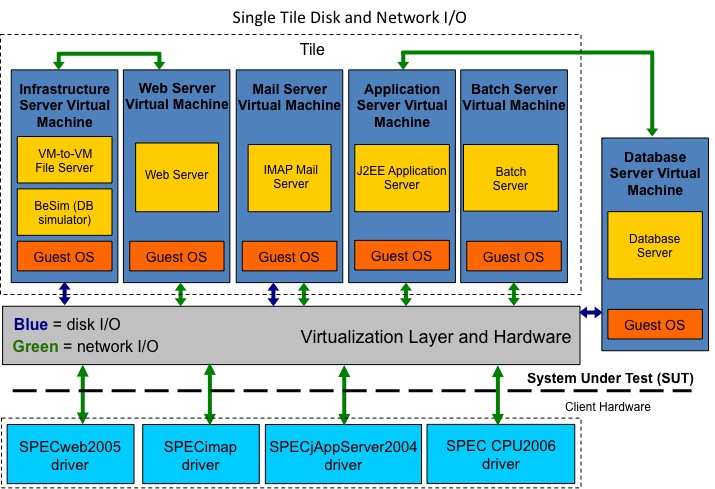
Rather than offering a single benchmark workload that attempts to approximate the breadth of consolidated virtualized server characteristics found today, SPEC virt_sc uses a four-workload benchmark design: a webserver, Java application server, a mail server, and a batch server workload. The four workloads of which SPEC virt_sc is composed are derived from SPECweb2005, SPECjAppServer2004, SPECmail, and SPEC CPU2006. All four workloads drive pre-defined loads against sets of virtualized machines (VMs). The SPEC virt_sc harness running on the client side controls the workloads and also implements the SPECpower methodology for power measurement. The benchmarker has the option of running with power monitoring enabled and can submit results to any of three categories:

As with all SPEC benchmarks, an extensive set of run rules govern SPEC virt_sc disclosures to ensure fairness of results. SPEC virt_sc results are not intended for use in sizing or capacity planning. The benchmark does not address multiple host performance or application virtualization.

1.1 Workload design

The benchmark suite consists of several SPEC workloads that represent applications that industry surveys report to be common targets of virtualization and server consolidation. We modified each of these standard workloads to match a typical server consolidation scenario's resource requirements for CPU, memory, disk I/O, and network utilization. The SPEC workloads used are: 

We created an additional workload called SPECpoll. SPECpoll sends and acknowledges network pings to all VMs in the 0% load phase (active idle) during power-enabled runs.

We researched datacenter workloads and determined suitable load parameters. We refined the test methodology to ensure that the results scale with the capabilities of the system. The benchmark requires significant amounts of memory (RAM), storage, and networking in addition to processors on the SUT. Client systems used for load generation must also be adequately configured to prevent overload. Storage requirements and I/O rates for disk and networks are expected to be non-trivial in all but the smallest configurations. The benchmark does not require that each workload have a maximum number of logical (hardware-wise) processors and is designed to run on a broad range of single host systems.

1.2 VMs and tiles

The benchmark presents an overall workload that achieves the maximum performance of the platform when running one or more sets of Virtual Machines called tiles.


Figure 1: The definition of a tile

To emulate typical datacenter network use, all VMs use an external (public) network to communicate to and from the clients and controller in the testbed. Optionally, the webserver and infrastructure server can share an internal (private) network connection as can the application server and database server.


Figure 2: Interaction between the tile and harness workloads

Scaling the workload on the SUT consists of running an increasing number of tiles. Peak performance is the point at which the addition of another tile (or fraction) either fails the Quality of Service (QoS) criteria or fails to improve the overall metric.


Figure 3: Multi-tile and harness configuration

Each Database Server VM represents an enterprise class VM and is shared by Appserver VMs of up to 4 tiles. For every four consecutive tiles, a separate Database Server VM is required. Only the last Database Server VM may be shared by fewer than four tiles, if there are not enough tiles. For example: when adding a fifth tile, a second Database Server VM should be added. At this point, only the fifth tile accesses the second Database Server VM. When the sixth to eighth tiles are added, they access the second Database Server VM as well. When adding a ninth tile, a third Database Server VM should be added.

When the SUT does not have sufficient system resources to support the full load of an additional tile, the benchmark offers the use of a fractional load tile. A fractional tile consists of an entire tile with all five VMs but running at a reduced percentage of its full load.

1.3 Metrics and submetrics

The primary metric is the normalized composite of the component submetrics. The benchmark supports three categories of results, each with its own primary metric. Results may be compared only within a given category; however, the benchmarker has the option of submitting results from a given test to one or more categories. The first category is Performance-Only and its metric is SPEC virt_sc which is expressed as SPEC virt_sc <Overall_Score> @ <5*Number_of_Tiles + Number_of_DBservers> VMs on the reporting page. The overall score is based upon the following metrics of the component workloads:
  • Webserver - requests/second at a given number of simultaneous sessions
  • Mailserver - the sum of all operations/second at a given number of users
  • Application server - Java operations/second (JOPS) at a given injection rate, load factor, and bursty curve (plus additional settings)
  • Batchserver - pass/fail (not part of the metric calculation)
We calculate the overall score by taking each component workload in each tile and normalizing it against its theoretical maximum for the pre-defined load level. The normalized throughput scores for each tile are averaged arithmetically to create a per-tile submetric, and the submetrics for all tiles are added to get the overall performance metric. The SPEC virt_sc metric includes reporting this overall metric along with the total number of VMs used.

You can configure one fractional tile to use one-tenth to nine-tenths (at increments of one-tenth) of a tile's normal load level. This allows the benchmarker to saturate the SUT fully and report more granular metrics.

The submetrics must meet the QoS criteria we adapted from each SPEC standard workload as well as any other validation that the workload requires. The details of the QoS criteria are documented in the Run and Reporting Rules document.

1.4 Power-enabled runs

The benchmarker has the option of running with power monitoring enabled and can submit results to either the performance with SUT power category and/or performance with Server-only power category. Their primary metrics, SPEC virt_sc_PPW (performance with SUT power) and SPEC virt_sc_ServerPPW (performance with Server-only power) are performance per watt metrics obtained by dividing the peak performance by the peak power of the SUT or Server, respectively, during the run measurement phase. For example, if the SPEC virt_sc result consisted of a maximum of six tiles, the power would be calculated as the average power while serving transactions across all 32 VMs (5*6 tiles + two database VMs = 32 VMs).

For power-enabled runs, performance measurements are taken during a 100% load phase, which is followed by a quiesce period and then an active idle phase (0% load). Power is measured for both the 100% load phase and the active idle phase.

1.5 Applications

The benchmark may use open source or free products as well as commercial products. The benchmark is designed to be open, and the choice of software stack is for the tester to decide. For example, for webserver, any web server software that is HTTP 1.1 compliant can be used. See other sections of this document and the Run and Reporting Rules for more details. Variations in implementations may lead to differences in observed performance.

1.6 Harness design

SPEC developed a test harness driver to coordinate running the component workloads in one or more tiles on the SUT. A command-line-based interface allows you to run and monitor the benchmark, collects measurement data as the test runs, post-processes the data at the end of the run, validates the results, and generates the test report.

For more detailed information, see Section 3.0 SPEC virt_sc Workload Controller.

2.0 SPEC virt_sc Workloads

The four primary workloads used in this benchmark are modified versions of the SPECjAppServer2004, SPECweb2005, SPECmail, and SPEC CPU2006 benchmarks. An additional SPEC virt_sc process is the SPECpoll; this process polls the VMs under loaded runs and all VMs during an active idle power measurement period. All of these workloads' prime clients are required to implement the PrimeRemote interface to enable RMI communication between the prime controller and these prime clients during a benchmark run.

Following are the key design modifications to the three existing SPEC benchmarks as well as the design definition of the SPECpoll process. Readers unfamiliar with any of the existing SPEC benchmarks are encouraged to familiarize themselves with the original benchmarks' design documents.

2.1 Application server workload

The application server workload is a derivative of SPECjAppServer2004 benchmark. This workload exercises a J2EE compliant application server and backend database server (DBMS). The modifications to this workload include modifications to the driver as well as a new interface to the workload to make it compatible with the SPEC virt_sc benchmark.

2.1.1 Workload driver interface

The SPECjAppServer2004 benchmark is designed to be script-initiated, which is incompatible with the SPEC virt_sc benchmark design. Because of this, two new classes were added to the workload's "launcher" directory: the jappserver and jappclient classes. The jappserver class is the workload's "prime client" that manages the workload activity via communication with the jappclient ("client") class on one end and with the prime controller on the other end. The jappserver class does this by implementing the PrimeRemote interface to listen for commands from the prime controller and by calling the RemoteControl interface to communicate with the jappclient class. The jappclient class includes most of the script-replacement code. However, not all changes are equivalent replacements of the script functionality.

The SPEC virt_sc benchmark is designed so that the prime controller sends signals to the prime clients to control benchmark execution, to poll the workload clients for data during the polling interval, and to return any errors encountered during a run. This meant that the Driver class in the driver package (driver.Driver) needs to be passed more information upon instantiation, and an InputListener class was required to listen on the input stream for the java process that starts the driver.Driver class. (This is because this class is started as a separate process, and therefore our only means of communicating with it is the input and output streams of the process.

The InputListener class acts as a filter on the java process' input stream, looking for receipt of the following signals:
  • getData: Returns the final (full-run) Dealer and Manufacturing statistics.
  • setTrigger: Notifies the Driver to begin benchmark execution.
  • clearStats: Notifies the Dealer, Manufacturing, and LargeOrder agents to clear all statistics previously collected and then tells them to resume collecting statitics. (This happens at the beginning of the common measurement interval.)
  • stopCollect: Notifies the Dealer, Manufacturing, and LargeOrder agents to stop collecting statistics and to stop the test. (This happens at the end of the common measurement interval.)
  • waitComplete: Notifies the Driver that the steady state period has ended. It also serves as the signal that lets the InputListener thread know that it can terminate, since it can expect no further signals.
Similarly, several properties are passed to the driver.Driver class and are passed as parameters to the class's constructor. These are:
  • -trigger: The value following this flag is set as the value for the triggerTime property.
  • -ramp: The value following this flag is set as the value for the rampUp property.
  • -stdy: The value following this flag is set as the value for the stdyState property.
  • -txScale: The value following this flag is set as the value for the txScale property. This is the multiplier applied to the txRate.
  • -test: The value following this flag is the POLLING_INTERVAL value and is used to calculate warmup behavior as well as for resetting the run time after the clearStats signal has been sent.
  • -tile: The value following this flag identifies which tile this workload is assigned to. It is used to calculate the correct bursty curve starting offset and the correct zig-zag warm-up pattern (if used).
  • -txRate: The value following this flag is set as the value for the txRate property and represents the average txRate, whether applied to a bursty curve or not. This is not used to set the txRate in the bursty curve case, but is still used for rate compliance calculations.
  • -numShared: The value following this flag is set as the value for the numShared property and represents the number of tiles that share a single Database Server VM. Only the appserver in the first tile of each group sharing a Database Server VM performs Database audit checks.

2.1.2 Workload driver modifications

Modifications to the benchmark described below are feature additions to the SPECjAppServer2004 benchmark driver implementation. Specifically, the SPEC virt_sc SPECjAppServer2004 driver has been modified such that the injection rate (IR) varies over time (referred to in the configuration files as "burstiness").

This waveform was chosen based on a study of resource utilizations from a large population of application and database servers active over an extended period of time. The IR waveform details, including the period and amplitude is specified and used for all tiles. There are 30 points in the curve, and each point in the curve is executed for 40 seconds ("stepRate", in run.properties). The average IR for the curve is 100. As the target IR increases, idle users from the driver "wake up" and become active. As the IR decreases, active users from the driver "sleep" and become idle.

To prevent an unrealistic complete overlap of this time varying IR waveform over multiple tiles, each tile starts at a point seven steps farther along the IR curve from the previous tile (startPointMultiplier, in run.properties). When the end of the curve is reached, the next IR value is determined by wrapping back to the first curve point of the waveform and continuing from that point. Below is the graph of the IR curve values (starting at the first IR value, burstyCurve[0]):


Figure 4: Single-cycle Injection Rate Curve

Two new methods for warming up the application server and database have been added. The first method (warmUpStyle = 0, in run.properties) simply increases the IR from zero to "warmUpIR" (specified in run.properties) for the duration of WARMUP_SECONDS (specified in Control.config). The second method (warmUpStyle=1) may have either two or three phases, depending on the length of the run interval.

Phase one warms up linearly from zero to warmUpIR. The duration of this first phase is calculated as WARMUP_SECONDS * linearWarmUpPercentage (specified in run.properties). The workload then calculates whether the remaining run time is greater than the polling interval plus the number of 20-minute bursty warm-up cycles specified. If so, it then runs at the average IR rate for this duration. If not, it proceeds immediately to the dynamic IR phase, starting at the IR point calculated as "(TILE_NUMBER * 7 ) mod 30". The duration of this phase must be multiples of 20 minutes in order to complete one or more full curve cycles prior to the POLLING_INTERVAL.

To increase the size of the database working set, the initial SPECjAppServer2004 database population has been increased by a factor of five (loadFactor, in run.properties). Given the predefined average IR of 100, this means the database has the equivalent population scale of 500IR from the original SPECjAppServer2004 benchmark. In order to access this increased working set size, the queries for the various Dealer and Manufacturing transactions have been modified to target this larger database population. Therefore, the database must be built for txRate(100) * loadFactor(5).

The methodology for Dealer user session logout and re-login to the application server (changeRate, in run.properties) has been changed, resulting in a decreased average session duration. Users now are chosen at random and log out and re-login at a rate of 30 per minute. This was implemented to limit the duration for which EJB session beans would typically be able to read application server cached data (further increasing DBMS disk or memory reads).

To meet the various transaction mix and rate requirements, the random number generator (RNG) functions have been modified to adjust rates upwards when they have been trending low, or downward if trending high. To alleviate overly short think times during peak loads on the appserver (which can result in unstable driver and SUT conditions), the think times are increased when the driver detects that the response times are becoming excessively long. Additionally, several of the transaction mix low and high bound tolerances are relaxed to further decrease the chance of failing mix requirements for low frequency operations.

Rate Metric Target
Value
New
Allowance
Original
Allowance
Vehicle Purchasing Rate 665 +/-3% +/-2.5%
Large Order Vehicle Purchase Rate 350 +/-7% +/-5%
Regular Vehicle Purchase Rate 315 +/-6% +/-5%


SPEC virt_sc requires that the emulator application is installed on each application server VM, and that each application server SPECjAppServer application uses its own locally installed emulator application (emulator.ear). This differs from the original SPECjAppServer2004 benchmark run rules requirements.

2.1.3 Application server workload polling

Requests for polling data sent by the prime controller return a set of comma-delimited metrics in the following format:

<System Poll Time>,<purchaseTxCnt>,<purchaseResp90>,<manageTxCnt>,<manageResp90>,<browseTxCnt>, <browseResp90>,<workOrderCnt>,<workOrderResp90>

The *Cnt values are the total purchase, manage, browse and work order counts from the beginning of the polling period and the *Resp90 values are the respective 90th percentile response times. Please refer to the SPECjAppServer2004 documentation for further information on these metrics.

2.2 Web server workload

The web server workload is a modified version of the SPECweb2005 Support workload and for SPEC virt_sc drives 2500 simultaneous HTTPS sessions against the web server VM. As with the other workloads, the specweb class implements the PrimeRemote interface and starts an RMI listener to listen for RMI commands from the prime controller.

2.2.1 Configuration changes

The modified SPECweb2005 workload adds some SPEC virt_sc-specific configuration properties to its configuration as well as overwrites some SPECweb configuration property values with values from the SPEC virt_sc configuration, as listed below:

Adds:
CLOCK_SKEW_ALLOWED
IGNORE_CLOCK_SKEW
POLLING_RMI_PORT

Overwrites:
CLIENTS
RUN_SECONDS
WARMUP_SECONDS
RAMPUP_SECONDS
SIMULTANEOUS_SESSIONS
BEAT_INTERVAL
MAX_OVERTHINK_TIME

2.2.2 Command line parameter changes

At the time the specweb prime client class is invoked by the clientmgr process, it also may be passed the following additional command line parameters:

The parameters for the first two bullets are always included and are provided by the prime controller based on the parameters in Control.config. The last bulleted item is optional and must be specified in the workload's PRIME_APP value, if desired. For example:

PRIME_APP[1] = "-jar specweb.jar -lh eth2hostname"

2.2.3 Workload modifications

The most significant change to the SPECweb2005 Support workload for SPEC virt_sc was to the fileset characteristics. The Support workload was revised to represent a larger website with file sizes more representative of software downloads and multimedia files currently found on many support sites. The access patterns have been altered by the combination of a smaller zipf alpha value, an increased number of download files per directory and changes to the frequency distributions for accessing those files. SSL and TLS have also been enabled as websites now commonly use HTTPS to secure their users' data. 

Following are the changes to the parameter values in SPECweb_Support.config related to these changes:

Property New value Original value
ZIPF_ALPHA 0.55 1.2
DIRSCALING 0.1 0.25
NUM_CLASSES 7 6
CLASS_0_DIST
CLASS_1_DIST
CLASS_2_DIST
CLASS_3_DIST
CLASS_4_DIST
CLASS_5_DIST
CLASS_6_DIST
0.117
0.106
0.264
0.203
0.105
0.105
0.100
0.1366
0.1261
0.2840
0.2232
0.1250
0.1051
N/A
DOWNLOADS_PER_DIR 24 16
CLASS_4_FILE_DIST
CLASS_5_FILE_DIST
CLASS_6_FILE_DIST
"0.575, 0.425"
"0.350, 0.220, 0.115, 0.100, 0.100, 0.115"
"0.475, 0.525"
1.000
1.000
N/A
CLASS_2_FILE_SIZE
CLASS_3_FILE_SIZE
CLASS_4_FILE_SIZE
CLASS_5_FILE_SIZE
CLASS_6_FILE_SIZE
"1048576, 256001"
"2097154, 1048573"
"3524287, 428901"
"4302606, 904575"
"35242871, 3904575"
"1048576, 492831"
"4194304, 1352663"
"9992929, 0"
"37748736, 0"
N/A

Also, because the web server file sets for each tile would otherwise contain identical data, the Wafgen file set generator was modified to add values to the data unique to each workload tile, and the SPECweb response validation process now checks for these unique values when it validates the file contents.

The parameter OVERTHINK_ALLOW_FACTOR was also added in order to loosen the client excess think time limits (MAX_OVERTHINK_TIME) on the client. MAX_OVERTHINK_TIME is now calculated as the RUN_SECONDS times the OVERTHINK_ALLOW_FACTOR. So client-caused delay in sending requests of up to 1% of the total run time is now allowed.

SSL and TLS support has also been enabled in the Support workload for SPEC virt_sc by setting USE_SSL = 1 in SPECweb_Support.config. This feature is required for compliant SPEC virt_sc benchmark runs.

2.2.4 Web server workload polling

Requests for polling data sent by the prime controller return the same polling data as the regular SPECweb2005 workload and is of the format:

<System Poll Time>,<Page Requests>,<Pass Count>, <Fail Count>,<Error Count>,<Total Bytes>, <Response Time>,<Time Good>,<Time Tolerable>, <Time Fail>,<Min Resp Time>,<Max Resp Time>, <Non-client close>

See the SPECweb2005 documentation for further information on these values.

2.3 IMAP mail server workload

The IMAP mail server workload is based loosely on the SPECmail benchmark.  The IMAP component of SPEC virt_sc simulates the load generated by 500 mail clients (for a compliant full tile) performing common mailserver activities such as checking for new messages, fetching, sending, and deleting messages, searches for particular mail text, etc.  The mailserver is pre-populated for each client user using a provided mailstore generation application (see the Mailserver VM Setup section of the User Guide for details). For ease of benchmarking, the benchmark maintains a persistent state from benchmark run to run, meaning that there are the same number of total messages at the beginning of each run, with each message maintaining the same initial state (e.g., SEEN versus UNSEEN).  The working size of the mailstore requires approximately 12GB of storage space (excluding ancillary mailserver folder structures, indices, etc).

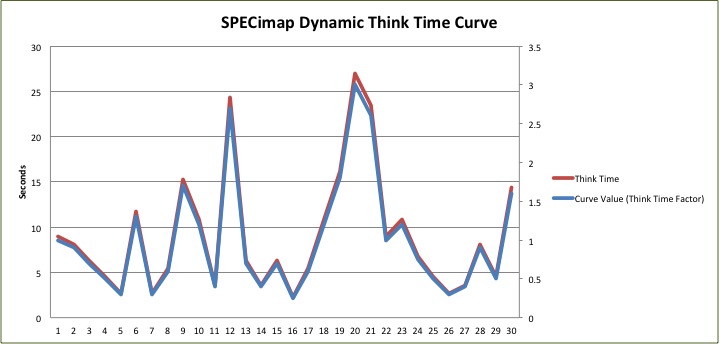
In order to simulate the dynamic nature of daily mailserver activity, the IMAP workload intensity for the 500 active users is dynamic over the measurement interval.  While the 500 users will all be active during the measurement interval, the average delay between IMAP requests changes based on a preset ‘think time curve’.   The average think time for primary IMAP operations over the entire Measurement Interval is 9 seconds. However, depending on the current position on the dynamic curve, the average think time at any given point varies from a minimum of 2.25 seconds to a maximum of 27 seconds.  Each tile will begin at a point in the curve which is offset from the previous tile by 7 curve point values.  This is to prevent an artificial overlap of peaks and troughs of workload activity.  Each point on the think time curve will execute for 20 seconds, which is the default “step rate” for the dynamic curve.  Each tile will traverse the think time curve every 10 minutes.  ( 30 curve points,  20 seconds per point = 600 seconds)

IMAP Dynamic Think TIme Curve  


There are two mail folders that are used during the test run.  The first is the common top level 'INBOX' which contains ~2000 pre-populated mail messages, 70% of which have been seen (SEEN flag is set) and 30% are unseen (UNSEEN flag is set).  The second folder is the SPEC folder which is used to store the messages that are created during the test run.  The messages that accumulate in this mailbox are occasionally deleted during the test run and are always automatically deleted prior to the beginning of the test run to maintain a consistent mailstore state from run to run.

2.3.1 Primary IMAP operations

The workload consists of four 'primary' IMAP operations:  create new mail message (APPEND), retrieve mail message (FETCH_RFC822), text search subject header (SEARCH_ALL_SUBJECT), and check for new messages in the 30 most recent messages (SEARCH_UNSEEN).  The user chooses a pseudo-random number to determine which primary operation to execute next based on the following transaction mix.  The allowed mix variations due to the nature of random selection are also shown below (i.e., the variance allowed of the final measured mix per IMAP operation over all transactions that occurred during the POLLING_INTERVAL). 

Primary IMAP command mix
IMAP Command Type Min. Allowed Target Max. Allowed
APPEND 26.31% 26.71% 27.11%
FETCH_RFC822 66.79% 67.81% 68.83%
SEARCH_ALL_SUBJECT      
3.25 3.43%  3.60%
SEARCH_UNSEEN 1.95% 2.06% 2.16%


2.3.2 Secondary IMAP operations

Each of the primary operations may trigger one or more secondary operations as described below.
 
Secondary APPEND operations:
The deletion of all accumulated messages in the SPEC folder (STORE_ALL_FLAGS_DELETED, followed by EXPUNGE) occurs for 2% of the APPEND primary operations.
 
Secondary FETCH operations:
Since 30% of the mailstore messages have the UNSEEN flag set, 30% of FETCH operations reset this flag after the FETCH operation to UNSEEN (UID_STORE_NUM_UNSET_FLAGS_SEEN) in order to maintain the consistent mailstore state.
 
Secondary SEARCH_UNSEEN operations:
The SEARCH_UNSEEN operation represents the typical IMAP client application that is often active throughout the workday and periodically checks the IMAP server for new messages.  Therefore, each SEARCH_UNSEEN have a corresponding login (IMAP_LOGIN), a logout (IMAP_LOGOUT).  Additionally, for every new message (flag set to UNSEEN) that is found in the most recent [10..30] mailstore messages, the message header is fetched using the PEEK IMAP command (FETCH_NUM_RFC822HEADER)
 
The allowed mix variations due to the nature of random selection are also shown below (i.e., the final mix determined at the end of the run over all transactions that occurred during the POLLING_INTERVAL). The percentage of allowed variation between the measured and the minimum and maximum mix is increased for secondary operations which occur at a low frequency.

2.3.3 Mail server workload polling

Requests for polling data sent by the prime controller return a set of comma-delimited metrics in the following format:

<System Poll Time>,<Total Count>,<Pass Count>,<Fail Count>,<Error Count>,<Total Resp. Time>,<Min Resp. Time>,<Max Resp. Time>

The *Count values are the total IMAP command counts from the beginning of the polling period. The 'Total Resp. Time' is the sum of the response time (in milliseconds) for all IMAP commands.

2.4 Batch server workload

The batch server is intended to represent a VM that is idle most of the time but has occasional spikes of activity that require moderate amounts of processing resources that can be provided at lower priority compared to others. The batch server uses one of the modules from the SPEC CPU2006 SPECint suite, 401.bzip2, as the batch workload. Ten copies of the 401.bzip2 "train" workload must be run within a specified time in order to satisfy the requirements for this workload. The batch workload does not have a metric that contributes to the overall SPEC virt_sc metric, but rather returns a PASS/FAIL result; as long as the entire batch workload completes in the specified time, it passes.

As with the other workloads, the specbatch class implements the PrimeRemote interface and starts an RMI listener to listen for RMI commands from the prime controller.

2.4.1 SPECbatch prime client

Like other workloads, the SPECbatch prime client, specbatch, uses two primary threads: one to listen for and respond to prime controller RMI calls and the other for workload execution. The SPECbatch RMI listener thread is similar in its implementation to all other workloads. The workload execution thread for the specbatch prime client launches a workload run script, defined by BATCH_SCRIPT in SPECbatch/Test.config, on the host VM with two parameters:

  1. Run results directory. This directory is defined by the specbatch.jar process which uses the benchmark start time as the base directory; this base directory is created in the BATCH_RES_DIR valaue specified in the Test.config file for SPECbatch. For each invocation of the batch script, a result_[x] directory is created in the base directory. The number of invocations is defined by the INTERVAL parameter defined in the Test.config file. For a compliant benchmark run, INTERVAL must equal 2.
  2. Number of jobs. This is the number of copies of the 401.bzip2 workload that is run. This value is defined by the BATCH_COPY_COUNT value. For a compliant benchmark run, BATCH_COPY_COUNT must equal 10.

For a multi-tile run, the specbatchclient process launches the workload script at different times on each tile depending on the tile ID. The first tile's workload script is launched as soon as the polling phase of the benchmark begins. The second tile's workload is launched a number of seconds later defined by the OFFSET parameter in Test.config, the third tile's workload is launched OFFSET seconds after the second tile's, and so on. If the number of tiles run exceeds the value OFFSET_RESET_TILECNT (defined in Test.config), the first tile after this value starts its workload at the beginning of the polling phase and the offsets for subsequent tiles are staggered from this time. This pattern repeats for each multiple of OFFSET_RESET_TILECNT. For a compliant run, OFFSET must equal 900 (15 minutes) and OFFSET_RESET_TILECNT must equal 4.

After period of time - defined by TIMEINTERVAL in SPECbatch/Test.config - from the start of the last workload script invocation, the next workload script invocation begins. For a compliant benchmark run, TIMEINTERVAL must equal 3600.

Once the workload execution thread launches the workload script, it monitors the status of the script and collects the results at the end of the benchmark. If the workload script runs longer than the expected value, defined by DURATION in Test.config, the workload fails validation.

2.4.2 SPECbatch workload

The SPECbatch workload is based on the SPEC CPU2006 harness. As such, certain steps must be followed in order to prepare the SPECbatch workload for execution. The SPECbatch workload only uses a subset of the SPEC CPU2006 harness and therefore cannot be used for compliant SPEC CPU2006 measurements.The SPEC CPU2006 harness provides the workload as source code, so it must be compiled prior to its use. Therefore a compiler must be available on the VM to accomplish this.

A batch run script must be created to control the execution of the SPECbatch workload. There are sample run scripts that are included in the kit that provide guidance in what is needed for such a script. Please refer to the next section for more details.

Once the workload executable and run script have been built, the SPECbatch workload is ready for use.

2.4.3 SPECbatch workload run script

The SPECbatch workload run script controls the manner in which the required number of 401.bzip2 workload executions are handled. The script is passed two parameters from the specbatch process, the run-specific results directory and BATCH_COPY_COUNT. The script then needs to accomplish four basic functions in order to achieve a compliant result:

  1. Remove the lock.CPU2006 file from the {SPEC_CPU_ROOT}/results directory. This resets the number count on the output files generated by running the CPU2006 suite. Caution: DO NOT remove the entire {SPEC_CPU_ROOT}/results directory from within the script. The tools  create a SPEC virt_sc-specific result directory within {SPEC_CPU_ROOT}/results to put the output files for the multiple executions of the run script, so removing the base directory also removes previous passes for the same SPEC virt_sc measurement.
  2. Execute BATCH_COPY_COUNT instances of 401.bzip2 from within the SPEC CPU2006 harness. This is achieved by setting up the CPU2006 environment by sourcing the shrc file (or running shrc.bat on Windows) and then using one or more invocations of the runspec commands of the form:

    runspec -l -n 1 -i train [-r {#copies}] -c {configuration file} -T base -o asc 401.bzip2

    The runspec invocations MUST be of this form with the exception of the "-r {#copies}". This parameter is not required and the benchmarker is free to run a single-copy runspec invocation BATCH_COPY_COUNT times, a single BATCH_COPY_COUNT-copy runspec invocation, or some combination of runspec invocations of fewer number of copies, as long as the total number of copies of 401.bzip2 is run across all runspec commands equals BATCH_COPY_COUNT.
  3. Create the run-specific results directory. Using the value of the first parameter passed to the script, it must create a new directory to place the output files generated by the invocations of runspec. The form of the directory path passed, assumes the script is run from {SPEC_CPU_ROOT}, so there is no need to provide the full path to the mkdir command.
  4. Move the result files from {SPEC_CPU_ROOT}/results to run-specific result directory. Copy all of the C* output files (including .log files) from {SPEC_CPU_ROOT}/result to the newly created  run-specific result directory.

As stated before, there are sample workload run scripts provided in the SPECbatch folder that can be used directly or as models for custom scripts. The script must be run from the SPECbatch/cpu2006-virt folder. There is a symbolic link in the SPECbatch/cpu2006-virt folder pointing to one of the sample workload scripts. The default value in Control.config points to this symbolic link.

The workload run script is platform dependent, so the specbatch process invokes the script using the shell environment defined by BATCH_RUN_ENVIRONMENT in the SPECbatch/Test.config.

2.4.4 Batch server workload polling

Requests for polling data sent by the prime controller return a string in the following format:

When the getData() request is received from the prime controller on the RMI listening thread, the SPECbatch prime client sends a getHeartbeat() RMI request to specbatchclient, which specbatchclient relays to the target VM. The format of the returned string of comma-separated variables is:

<System Poll Time>,<Heartbeats>,<Total Beats>,<Resp. Msec>,<Min. Msec>,<Max. Msec>,<Total Msec>,<QOS Pass>,<QOS Fail>

Please refer to the SPECpoll polling section for details on these values.

2.5 SPECpoll

SPECpoll is used to poll the server VMs to confirm that they are running and responsive. While not a workload it behaves like the other workloads. It must implement the PrimeRemote interface for the prime controller to be able to communicate with it through RMI. Beyond implementing this common communication interface, the SPECpoll process fundamentally just waits for and responds to polling commands from the prime controller.

There are three jar files used for SPECpoll: specpoll.jar, specpollclient.jar, and pollme.jar. The first two provide the prime client and client interface to the workload common to all workloads in the benchmark client harness. The latter jar file, pollme.jar, is not used on the client side, but must be installed and running on all VMs so that it can listen for and respond to polling requests from specpollclient.

SPECpoll's primary function is to poll all VMs during an active idle measurement interval. It is in order to provide this function that the SPECpoll process must be installed on each set of client systems that host the four workloads. Specifically, during an active idle measurement interval, the prime client goes to the same set of PRIME_HOSTs and WORKLOAD_CLIENTS defined in Control.config for the loaded measurement interval, but instead of starting the mail, web, batch, and appserver workloads, it starts the SPECpoll process.

2.5.1 SPECpoll prime client

SPECpoll prime client (specpoll) uses two primary threads: one to listen for and respond to prime controller RMI calls and the other for process execution. The SPECpoll RMI listener thread is similar in its implementation to the four workloads. The process execution thread for the specpoll prime client is as simple of a process execution sequence as is possible for this virtualization benchmark and consists of the following sequence of steps:

  1. Call getHostVMs() on the prime controller to get the name of the host VM or VMs that SPECpoll is expected to poll.
  2. Pass the configuration and host VM list to the SPECpoll client (specpollclient)
  3. Open up a result file in which to capture (raw) test results at the end of the test.
  4. Check the clock skew between the client and the VMs. (This step is skipped for active idle run intervals.)
  5. Call setIsWaiting() on the prime controller to tell the prime controller that it is ready to start its ramp-up phase.
  6. Wait for the setIsRampUp() RMI call from the prime controller. (This is the "go" signal.)
  7. Put the thread to sleep for the ramp-up interval duration.
  8. Send setIsStarted(true) RMI command to the prime controller to let the prime controller know ramp-up time has finished and warm-up time is beginning.
  9. Put the thread to sleep for the warm-up interval duration.
  10. Send setIsRunInterval(true) to the prime controller to let it know that the run interval has started for this workload.
  11. Put the thread to sleep for the runtime interval duration.
  12. Send setIsRunInterval(false) to the prime controller to let it know that the run interval has ended for this workload.
  13. Send setIsStarted(false) to the prime controller to signal that the SPECpoll process execution thread is finished, so that the prime controller knows that the four workloads are ready to return run result data.

At first glance it might appear as though this process does nothing at all since the process execution thread sleeps during the ramp-up, warm-up, and runtime phases of the four workloads. However, VM polling is only required in response to a prime controller RMI command, getData(), which is executed on the RMI listener thread that listens for RMI commands from the prime controller. So unlike the four workloads that drive load during a run interval, there is nothing more that this "primary" process execution thread needs to do during these periods other than to wait until these phases have expired.

2.5.2 SPECpoll client

Like the SPECpoll prime client process, the SPECpoll client process (specpollclient) is a minimal client process implementation. In addition to maintaining and returning the metric results (common to all workload client processes), specpollclient has two primary methods: setConfig() and getHeartbeat().

The setConfig() method checks the QOS metric values used in the configuration object passed to it by the specpollclient and gets the target host VM and RMI port. It then checks whether a second host VM name:port pair was passed to it. If so, when it makes the setConfig() RMI call to the target VM's pollme process, it passes that name:port pair to the target VM's SPECpoll listener. Once this is done, the target VM has all of the information it neeeds to respond to getHeartbeat() RMI requests.

When the specpollclient process receives a getHeartbeat() request from the specpoll prime client, it forwards this request to its corresponding SPECpoll listener and processes the data returned. It then returns the results to the SPECpoll prime client, prefixing the data with the specpollclient's system time, measured after receiving the getHeartbeat() response from the target VM.

2.5.3 SPECpoll listener

The SPECpoll listener (pollme) runs on all VMs with which the SPECpoll clients are expected to send polling requests. The pollme listener, after being invoked and setting itself up to listen on the specified network interface and port, simply waits for setConfig() and getHeartbeat() RMI calls.

Before receiving a getHeartbeat() RMI call, the SPECpoll client first needs to send a setConfig() command to the pollme listener. If the listener is expected to relay a getHeartbeat() RMI call to a backend server, this backend host name and listening port are passed in the setConfig() RMI call. Tthe pollme listener uses the host VM name parameter sent with the setConfig() RMI call to set up an RMI connection to that host name and port for relaying future getHeartbeat() RMI calls.

When a getHeartbeat() RMI call is received from the SPECpoll client by the SPECpoll listener, it checks whether it needs to relay the getHeartbeat() RMI call to a backend server, and if so, makes its own getHeartbeat() RMI call to the backend server. Each getHeartbeat() RMI call returns one "heartbeat" along with however many heartbeats are returned by any relayed getHeartbeat() call to a backend server. So for the mailserver and batchserver that have no backend server, these calls return "1" and for the webserver and application servers that have backend servers, these getHeartbeat() RMI calls return "2" to the SPECpoll client.

These SPECpoll listeners have no concept of a benchmark begin and end time. They simply remain listening on the network interface and port on which they were started, waiting for RMI commands until these processes are terminated manually. The client harness does not stop or start these listening processes on the VMs.

2.5.4 SPECpoll polling

During an active idle measurement phase, requests for polling data sent by the prime controller return a string in the following format.

When the prime controller receives the getData() request from on the RMI listening thread, the SPECpoll prime client sends a getHeartbeat() RMI request to specpollclient, which specpollclient relays to the target VM. The format of the returned string of comma-separated variables is:

<System Poll Time>,<Heartbeats>,<Total Beats>,<Resp. Msec>,<Min. Msec>,<Max. Msec>,<Total Msec>,<QOS Pass>,<QOS Fail>

3.0 SPEC virt_sc workload controller

3.1 Prime controller and workload interaction

The client harness controls the four modified SPEC benchmark workloads. The workload modifications that change the behavior of the workload are explained in more detail in previous sections of this guide. This section focuses on how the client harness controls these workloads and the modifications made to these workloads that allow for this control and coordination.

Each workload is required to implement the PrimeRemote interface. This interface provides the names of the RMI methods that the prime controller expects any workload to be able to execute in order to ensure correct coordination of execution of these workloads. Correspondingly, each workload can rely on the availability of the RMI methods listed in the SpecvirtRemote interface for the prime controller. These methods are also a part of the coordination mechanism between the prime controller and the workloads. A listed description of these methods is provided in previous sections of this guide.

Below is the sequence of events that occur between the prime controller and the workloads during benchmark run execution. (This sequence assumes the client manager (clientmgr) processes have been started for each workload prime client and for the corresponding workload client processes. It also assumes that the pollme processes have been started on the VMs and are listening on their respective ports, as well as any power/temperature daemon (PTDaemon) processes used to communicate with power or temperature meters. Upon starting the specvirt process:

  1. The prime controller reads in the configuration values in Control.config, calculates the required run times for each workload and each workload tile based on the ramp, warmup, and any delay values specified. It then overrides any workload run time values written in any workload-specific configuration files with these values specified in Control.config as well as the run time calculation. Note that the run time calculation is required to ensure there is a common polling interval of POLL_INTERVAL_SEC across all workloads used in the test.
  2. The prime controller starts its RMI server, where it listens for RMI calls from the workload prime clients.
  3. It then creates a results directory, if required, and creates a new thread that controls the remainder of the benchmark execution. (The original thread is then available to handle RMI calls from the workload prime clients asynchronous from the rest of benchmark execution.)
  4. The number of values in LOAD_SCALE_FACTORS determines the number of run intervals. For each interval it first creates a results directory in which to include results information specific to that run interval.
  5. If the tester has chosen to have the prime controller copy workload-specific configuration files from the prime controller to the prime clients for their use in these tests, these files are copied from the prime controller to the prime client hosts. These would be the files and corresponding directories supplied in Control.config under the keys PRIME_CONFIG_FILE, LOCAL_CONFIG_DIR, and PRIME_CONFIG_DIR.
  6. The prime controller then instantiates the PtdController to communicate with the PTDaemons used for the benchmark run, connects to the PTDaemon, and sends an Identify command to the PTDaemon to find out whether it is talking to a power meter or a temperature meter.
  7. For each prime client, the prime controller creates a separate thread that waits for the prime controller to send it commands. If this is the first run interval, it also creates and opens the raw report file in which run results are written.
  8. If the benchmark has been configured to execute a pre-run initialization script on the prime client(s), the prime controller next gives the name of the initialization script to the clientmgr process to execute.
  9. There may be a need to delay the starting of the prime clients (in order for the clients to complete their initialization), and this is controlled by PRIME_START_DELAY. If set, the prime controller then waits PRIME_START_DELAY seconds before trying to start the prime clients, after which the prime controller directs the clientmgr processes to start the prime clients they are hosting.
  10. The prime controller then waits up to RMI_TIMEOUT seconds for the prime clients to report back to the prime controller that they have started correctly and are listening on their respective ports for RMI commands.
  11. Once all prime clients have reported back successfully, the prime controller then does a Naming lookup on these prime clients. Once attained, it then calls getHostVM() to collect the hostnames of the VMs these prime clients are running against. (The prime controller needs these for the active idle polling in order to provide a VM target to the polling process.)
  12. The prime controller then makes the RMI call getBuildNumber() to each prime client to collect the specvirt-specific version numbers of the workloads running on each client and prime client process. The prime clients make the same call to their clients to collect the client build numbers. If the prime client and client build numbers match, the prime client sends back a single build number. Otherwise, it sends back both build numbers. (The prime controller does not talk directly to the clients, only the prime clients.) The prime controller then verifies that all build numbers match.
  13. The setIsWaiting() RMI call from the prime clients to the prime controller is sent by each workload prime client when they are ready to start their ramp-up phase. Once these have been received from all prime clients, the prime controller sends a getSysTime() RMI command to each prime client to verify that their system clocks are synchronized with the prime controller and, once verified, the prime controller sends the setIsRampUp() call to signal the prime clients to start the ramp-up phase.
  14. The prime controller next waits for all prime clients to report that they are in their run interval (that is, their measurement phase). It then tells all of the prime clients to clear any results collected prior to that point, tells the PTDaemons to start collecting power data, and polls the prime clients for results for POLL_INTERVAL_SEC seconds.
  15. At the end of this polling interval, the prime controller tells the prime clients to stop collecting results, tells the PTDaemons to stop collecting power and/or temperature data and waits for all prime clients to report that their runs have completed (indicating that run results are ready to be collected).
  16. The prime controller then calls getValidationRept() on each prime client, expecting them to return any validation errors encountered by that workload during the run, and it writes those validation errors into the raw results file for that run interval in the format ERR-<interval>-<error reported>.
  17. The prime controller uses the RMI call getResFiles() to ask the prime clients for their result files. The returned files are written to the interval-specific results directory.
  18. Next follow three RMI calls to the workload prime clients: isCompliant(), getMetric(), and getQOS(). isCompliant() returns whether the run was deemed compliant by the workload prime client, getMetric() returns the primary performance result attained for that interval for that workload, and getQOS() returns the corresponding quality of service result metric for that same interval. All of these values are written to the raw results file in the form "PRIME_CLIENT.COMPLIANCE[tile][wkload] =...", "PRIME_CLIENT.METRIC_VALUE[tile][wkload] =...", and "PRIME_CLIENT.QOS_VALUE[tile][wkload] =..."
  19. The next RMI request made to the workload prime clients is getSubQOS(), which returns any submetric data to be included in the raw result file and report. These are returned as label-value pairs and are also written to the raw results file as such.
  20. If power was measured during this run interval, the prime controller then gets the measured power values, and writes the results for each of the PTDaemons to the raw results file in the form <interval>-PTD[<ptd_number>] = ...
  21. The prime controller next tells the relevant clientmgr processes to stop the workload client processes that they are hosting via the stopMasters() RMI command. If there are additional load intervals to run, the prime controller next waits for the quiesce period (QUIESCE_SECONDS) and then begins another run interval (back to Step 4).
  22. After all run intervals complete successfully, the prime controller writes the configuration information into the results file, encodes the results, and appends the encoded data to the end of the file. It then passes the results file to the reporter to create the formatted reports and then exits.

On both the prime controller and on each of the prime clients there are typically two separate threads engaged in different tasks. For the prime controller, one thread is primarily responsible for listening for and responding to RMI calls ,and the other is primarily responsible for controlling prime client execution. On the prime clients, similarly there is a thread primarily tasked with listening for and responding to RMI calls from the prime controller, and a second thread is responsible for coordinating its workload run with its workload clients.

The following flow diagram illustrates the sequence of interactions between these threads:

Figure 5. Sequence of SPEC virt_sc RMI command interactions

The above flow diagram only represents RMI calls specific to communication between the prime controller, the client managers, and the workloads. Each workload also has its own (workload-specific) set of RMI methods used for intra-workload communication which are not represented in the above diagram.

3.2 Power measurement

The SPEC virt_sc benchmark incorporates two classes to interface with SPEC's Power and Temperature Daemon (PTDaemon): the PtdConnector and PtdController classes. There is one PtdConnector per power/temperature daemon and a single PtdController that controls communication between these PtdControllers and their respective power/temperature daemons. Please refer to the SPEC PTDaemon Design Document contined in the Documentation section of the SPECpower_ssj2008 benchmark website for further information on the power and temperature daemon with which these classes interface.

3.2.1 The PtdConnector class

The PtdConnector class is the interface to the power or temperature daemon (PTDaemon) to which it is assigned. It is responsible for connecting with and disconnecting from the PTDaemon, as well as sending messages to and reading responses from the PTDaemon. There is one PtdConnector for each power or temperature daemon.

3.2.2 The PtdController class

The PtdController class manages the information sent to and received from the PTDaemons via the PtdConnector classes. It creates a separate "job thread" for each PtdConnector though which it sends commands and acts upon the responses returned. It also creates unique threads for each PtdConnector for PTDaemon polling.

The commands sent to the PTDaemons via the PtdController are:
  • Identify: This sends the "Identify" message to the PTDaemon and checks the response to determine whether the PTDaemon is in power or temperature mode
  • Go: This sends the "Go" message to the PTDaemon, passing it the PTDaemon sampling rate (0 unless overridden) and the number of ramp-up samples (0 for this benchmark). This begins an untimed measurement interval.
  • Timed: This sends the "Timed" message to the PTDaemon, passing it the number of samples to collect, the number of ramp-up samples, and the number of ramp-down cycles. This timed measurement mode is not used in this benchmark.
  • Stop: This sends the "Stop" message to the PTDaemon. This stops the untimed measurement interval.
  • (Get Values): After the measurement interval has been stopped and the test has completed, the PTDaemons in power mode are polled for the following values: "Watts", "Volts", "Amps", and "PF". Those PTDaemons that are in temperature mode are polled for "Temperature" and "Humidity".
During the workload polling period, the PtdController also sends commands for data from the PTDaemons at the same polling interval used for performance data polling. Which data it returns is controlled by the values for POWER_POLL_VAL and TEMP_POLL_VAL in Control.config, but for a compliant benchmark run these must be "Watts" and "Temperature", respectively. The data returned from these commands is the average watts or temperature since the beginning of the measurement interval.

3.3 Result (.raw) file generation

The prime controller generates a result file and consists of three sections: the polling and runtime results section on top, the configuration section in the center, and the encoded section at the bottom of the file.

3.3.1 Polling and runtime result recording

For each polling interval, the polling data is collected from the workload prime clients and this data is recorded in the result file. It is recorded exactly as returned to the prime controller in the CSV format:

<tile>,<wkload>,<prime_client_timestamp>,< workload-specific CSV data>

If there is power-related data (i.e. if USE_PTDS =1), then power/temperature polling data is also recorded following the workload polling data in the CSV format:

PTD[n],<timestamp>, <PTDaemon type-specific CSV data>

After the polling interval is complete and all of this polling data has been collected and recorded, all configuration validation or runtime errors for this interval are collected by the prime controller and recorded following the polling data in the format:

ERR-<run_interval>-<tile>-<wkload>-<error_number> = <error string>

Next recorded in the result raw file are the aggregate runtime results, starting with the workload-specific compliance, throughput, and QoS metrics in the format:

<run_interval>-PRIME_CLIENT.COMPLIANCE[<tile>][<wkload>] = <true | false>
<run_interval>-PRIME_CLIENT.METRIC_VALUE[<tile>][<wkload>] = <value>
<run_interval>-PRIME_CLIENT.QOS_VALUE[<tile>][<wkload>] = <value>


Immediately following this data are the load levels used during the run interval, reported in the format:

<run_interval>-PRIME_CLIENT.LOAD_LEVEL[<tile>][<wkload>] = <value>

Following these values are the workload-specific submetric values. Because there are multiple submetric types as well as submetric values, the multiple values are listed in CSV format and the multiple types of workload-specific submetric data are distinguished by separate indexes. The first line (type index 0), for each workload is reserved for the workload-specific submetric labels, and these are recorded in the format:

<run_interval>-PRIME_CLIENT.SUBMETRIC_VALUE[<tile>][<wkload>][0] = "<workload-specific CSV labels>"

This line is required in order to support the workload-agnostic architecture of the prime controller. If a new workload was added (or one was replaced), changing these labels is all that is required in order for the prime controller to be able to support a different set of workload submetrics.

Following this submetric label for the tile and workload is that workload's request type-specific data in the format:

<run_interval>-PRIME_CLIENT.SUBMETRIC_VALUE[<tile>][<wkload>][<req_type>] = "<workload-specific CSV values>"

The number of CSV labels in the 0-indexed SUBMETRIC_VALUE must match the number of CSV values contained in all of the greater-than-0 request type indexes that follow for that workload. Also, the number of submetric request types are not required to be identical for all workloads. For example, the jApp workload and the mail workload each have two request types (manufacturing and dealer for jApp, and append and fetch for mail) and therefore two request type indexes (1 and 2), while the web and batch workloads each have only one request type (support and heartbeats, respectively) and therefore only one request type index (1).

The final set of aggregate data are the power-related measurement data. For power meters, the data collected is the watts, volts, amps, and power factor. For temperature meters, it collects the temperature and humidity. This data is of the format:

<run_interval>- PTD[n][<data_type>] = "<PTDaemon data type-specific CSV values>"

This data is followed by a newline character, a string of dashes, and another newline character. If there is more than one run interval, the same data from the next run interval is recorded.

3.3.2 Configuration data

Once all run intervals have completed, the runtime configuration values are recorded in the result file. These included the configuration properties from the Control.config and Testbed.config files as well as all configuration properties created by the prime controller during the benchmark run. One example of the controller-generated configuration properties is the RUN_SECONDS properties. These are calculated and set by the prime controller for each workload to ensure it meets the specified POLL_INTERVAL_SEC value.

3.3.3 Encoded data

Once all of the above data has been recorded in the results file, the prime controller takes all of this information and encodes and appends it to the end of the file. This provides an ability to compare the original post-run configuration with any post-run editing done on this file, and this capability is used by the reporter in order to ensure that only allowed field editing is added to any submission file created using the reporter.

3.4 The SPEC virt_sc reporter

The SPEC virt_sc reporter is used to create result submission files from raw files, regenerate raw files after editing them post-run, and to create formatted HTML run result pages. It is invoked automatically by the prime controller to create the formatted HTML page at the end of a run, but must be run manually to generate submission files or to regenerate an edited raw file.

3.4.1 Raw file editing and regeneration

Raw files commonly require post-run editing in order to update, correct, or clarify configuration information. However, only the RESULT_TYPE property in Control.config and the properties in Testbed.config are allowed to be edited in the raw result file. (Many configuration properties in Control.config are editable before a run starts, but cannot be edited afterward.)

The reporter ensures that only editable values are retained in a regenerated raw or submission file using the following set of regeneration steps:

  1. Append ".backup" to submitted raw file name and save it. Since the reporter overwrites the raw file passed to it, it saves the original file contents by appending the ".backup" extension to the file name.
  2. Strip the polling and runtime results data from the raw file.
  3. Put the configuration property key/value pairs from the raw file into a Hashtable for comparison with the original, unedited key/value pairs.
  4. Decode the original raw file data from the encoded data at the bottom of the raw file and put its configuration key/value pairs in a separate Hashtable for comparison with the edited set of key/value pairs.
  5. Copy the original, unedited polling and runtime result data from the decoded raw file to the beginning of the regenerated raw file.
  6. Compare the original and edited Hashtable key/value pairs. If a key/value pair has been edited, added, or removed, check the property name against the list of properties for which post-run editing is allowed. Edit, add, or remove only the properties for which editing is permitted. Retain the others, unedited, from the original results and append the resulting valid set of configuration properties to the raw file being regenerated.
  7. Append the original encoded file to the end of the regenerated, new raw file.

Note: In order for the configuration property string comparison to work correctly cross-platform, any Windows backslashes are converted to forward slashes before being stored in Hashtables, even for non-editable fields. Therefore, a regenerated raw file's configuration properties always contain forward-slash characters in place of backslash characters, even where backslash characters existed in the original raw file in post-run non-editable fields.

The reporter concurrently creates the new raw file as well as the submission (.sub) file when regenerating the raw file except in the case where a sub file was passed into the reporter rather than a raw file.

Once a valid raw file and/or submission file have been generated, the reporter then uses this regenerated raw file to create the HTML-formatted final report(s). See the section titled Formatted (HTML) File Generation below for further details.

3.4.2 Submission (.sub) file generation

Any time you invoke the reporter with the parameters used to create a submission file, it assumes an edited raw file has been passed to it and goes through the editing validation process, assuring and preserving only allowed edits of the raw file submitted. Once a valid raw file has been recreated, the reporter then prefixes all non-configuration properties with a # character to preserve them in the submission process, and then prefixes the configuration properties with spec.virt_sc2013. per the SPEC submission tool requirements. This modified file is saved with a .sub extension, identifying it as a submittable raw file.

3.4.3 Formatted (HTML) file generation

All invocations of the reporter with the "-s" or "-r" flags result in one or more formatted HTML reports being generated for the corresponding raw file or submission file. There are three different types of HTML-formatted reports the reporter can create depending on the type of benchmark run and the RESULT_TYPE or type parameter value passed to the reporter.

If no PTDaemons were used in the run, then the reporter  always generates only a performance report, regardless of the RESULT_TYPE or -t value passed to the reporter. The RESULT_TYPE and/or -t parameter values only control result type generation for benchmark runs that include power data. The type of report generated is appended to the html file name in the following formats:

performance-only: <raw_file_name>-perf.html
server-only perf/power: <raw_file_name>-ppws.html
server-plus-storage perf/power: <raw_file_name>-ppw.html

While the reporter raw file regeneration process is responsible for validating post-run editing of the raw file, it is during the formatted HTML report generation process that the reporter checks for errors and configuration settings during a run that make a run non-compliant. So having a regenerated raw file containing only valid edits is not the same as having a SPEC-compliant result.

During formatted report generation the reporter checks for both workload-specific and benchmark-wide runtime and configuration errors. If it encounters any of these, the reporter records these in the Validation Errors section of the formatted report, and in place of the primary benchmark metric in the upper right corner of the report, the reporter prints:

Non-compliant! Found <n> compliance errors

It is the presence of a SPEC metric in the upper right corner of the report that verifies that the report generated contains SPEC-compliant results and only valid post-run edits.


Product and service names mentioned herein may be the trademarks of their respective owners.

Copyright © 2013-2016 Standard Performance Evaluation Corporation (SPEC).

All rights reserved.