SPECpower_ssj2008
Host 'Node06' Performance Report
Copyright © 2007-2018 Standard Performance Evaluation Corporation
| Hewlett Packard Enterprise Synergy 660 Gen10 Compute Module | ssj_ops@100% = 11,570,919 ssj_ops@100% per JVM = 1,446,365 |
||||
| Test Sponsor: | Hewlett Packard Enterprise | SPEC License #: | 3 | Test Method: | Multi Node |
| Tested By: | Hewlett Packard Enterprise | Test Location: | Houston, TX, USA | Test Date: | Aug 27, 2018 |
| Hardware Availability: | Jun-2018 | Software Availability: | Mar-2018 | Publication: | Sep 12, 2018 |
| System Source: | Single Supplier | System Designation: | Server | Power Provisioning: | Line-powered |
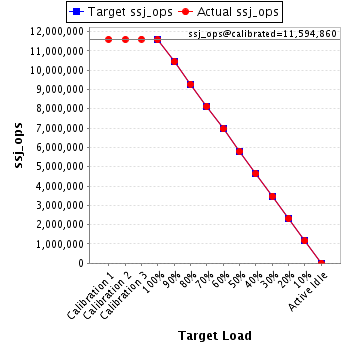
| Target Load | Actual Load | ssj_ops | |
|---|---|---|---|
| Target | Actual | ||
| Calibration 1 | 11,595,383 | ||
| Calibration 2 | 11,586,543 | ||
| Calibration 3 | 11,603,178 | ||
| ssj_ops@calibrated=11,594,860 | |||
| 100% | 99.8% | 11,594,860 | 11,570,919 |
| 90% | 90.0% | 10,435,374 | 10,438,373 |
| 80% | 80.0% | 9,275,888 | 9,276,807 |
| 70% | 70.0% | 8,116,402 | 8,120,601 |
| 60% | 60.0% | 6,956,916 | 6,952,664 |
| 50% | 50.0% | 5,797,430 | 5,800,503 |
| 40% | 40.0% | 4,637,944 | 4,633,230 |
| 30% | 30.0% | 3,478,458 | 3,479,334 |
| 20% | 20.0% | 2,318,972 | 2,316,840 |
| 10% | 10.0% | 1,159,486 | 1,160,092 |
| Active Idle | 0 | 0 | |
| Set Identifier: | SUT |
| Set Description: | System Under Test |
| # of Identical Nodes: | 5 |
| Comment: | SUT |
| Hardware | |
|---|---|
| Hardware Vendor: | Hewlett Packard Enterprise |
| Model: | Synergy 660 Gen10 Compute Module |
| Form Factor: | Other |
| CPU Name: | Intel Xeon Platinum 8180 2.50GHz |
| CPU Characteristics: | 28-Core, 2.50 GHz, 38.5MB L3 Cache |
| CPU Frequency (MHz): | 2500 |
| CPU(s) Enabled: | 112 cores, 4 chips, 28 cores/chip |
| Hardware Threads: | 224 (2 / core) |
| CPU(s) Orderable: | 1,2,3,4 chips |
| Primary Cache: | 32 KB I + 32 KB D on chip per core |
| Secondary Cache: | 1 MB I+D on chip per core |
| Tertiary Cache: | 39424 KB I+D on chip per chip |
| Other Cache: | None |
| Memory Amount (GB): | 384 |
| # and size of DIMM: | 24 x 16384 MB |
| Memory Details: | 24 x 16GB 2Rx8 PC4-2666-V ECC; slots 1, 3, 5, 8, 10 and 12 populated on each CPU socket |
| Power Supply Quantity and Rating (W): | None |
| Power Supply Details: | Shared |
| Disk Drive: | 1 x HPE 480GB SATA 6G Read Intensive M.2 (875319-B21) |
| Disk Controller: | 1 x HPE Smart Array S100i SR Gen10 (784308-B21) |
| # and type of Network Interface Cards (NICs) Installed: | 1 x HPE Synergy 3820C 10/20Gb 2-port Converged Network Adapter (777430-B21) |
| NICs Enabled in Firmware / OS / Connected: | 2/1/1 |
| Network Speed (Mbit): | 10000 |
| Keyboard: | None |
| Mouse: | None |
| Monitor: | None |
| Optical Drives: | No |
| Other Hardware: | None |
| Software | |
|---|---|
| Power Management: | Enabled (see SUT Notes) |
| Operating System (OS): | Windows Server 2012 R2 Datacenter |
| OS Version: | Version 6.3 (Build 9600) |
| Filesystem: | NTFS |
| JVM Vendor: | Oracle Corporation |
| JVM Version: | Oracle Java HotSpot(TM) 64-Bit Server VM (build 24.80-b11, mixed mode), version 1.7.0_80 |
| JVM Command-line Options: | -server -Xmn19g -Xms21g -Xmx21g -XX:SurvivorRatio=1 -XX:TargetSurvivorRatio=99 -XX:AllocatePrefetchDistance=256 -XX:AllocatePrefetchLines=4 -XX:LoopUnrollLimit=30 -XX:InitialTenuringThreshold=12 -XX:MaxTenuringThreshold=15 -XX:ParallelGCThreads=28 -XX:InlineSmallCode=3900 -XX:MaxInlineSize=270 -XX:FreqInlineSize=2500 -XX:+AggressiveOpts -XX:+UseLargePages -XX:+UseParallelOldGC |
| JVM Affinity: | start /NODE [0,2,4,6] /AFFINITY [0x0000000FC0FF, 0xFC0FF0000000]; start /NODE [1,3,5,7] /AFFINITY [0x0000000FF03F,0xFF03F0000000] |
| JVM Instances: | 8 |
| JVM Initial Heap (MB): | 21000 |
| JVM Maximum Heap (MB): | 21000 |
| JVM Address Bits: | 64 |
| Boot Firmware Version: | I43 v1.32 (02/01/2018) |
| Management Firmware Version: | 1.15 August 17 2017 |
| Workload Version: | SSJ 1.2.10 |
| Director Location: | Controller |
| Other Software: | HPE Composer Version 3.10.07 (HPE OneView) with HPE Synergy Custom SPP Bundle 2017.10.20180323; Microsoft Windows KB4054519, KB4056898 |
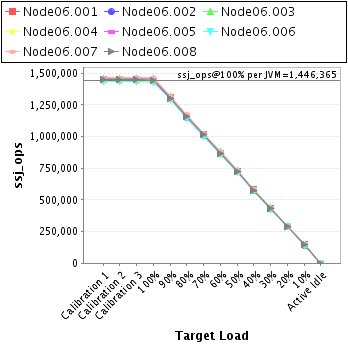
| JVM Instance | ssj_ops@100% |
|---|---|
| Node06.001 | 1,446,776 |
| Node06.002 | 1,439,865 |
| Node06.003 | 1,457,030 |
| Node06.004 | 1,432,949 |
| Node06.005 | 1,452,563 |
| Node06.006 | 1,430,225 |
| Node06.007 | 1,465,063 |
| Node06.008 | 1,446,449 |
| ssj_ops@100% | 11,570,919 |
| ssj_ops@100% per JVM | 1,446,365 |
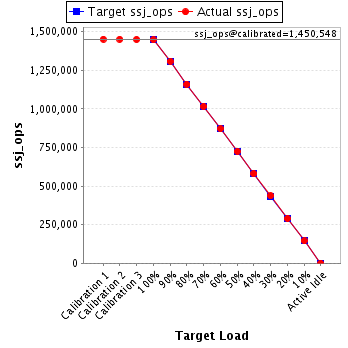
| Target Load | Actual Load | ssj_ops | |
|---|---|---|---|
| Target | Actual | ||
| Calibration 1 | 1,451,721 | ||
| Calibration 2 | 1,451,398 | ||
| Calibration 3 | 1,449,698 | ||
| ssj_ops@calibrated=1,450,548 | |||
| 100% | 99.7% | 1,450,548 | 1,446,776 |
| 90% | 90.2% | 1,305,493 | 1,308,624 |
| 80% | 80.0% | 1,160,438 | 1,159,726 |
| 70% | 70.1% | 1,015,383 | 1,017,140 |
| 60% | 60.0% | 870,329 | 870,463 |
| 50% | 50.0% | 725,274 | 725,165 |
| 40% | 40.0% | 580,219 | 579,561 |
| 30% | 30.1% | 435,164 | 436,274 |
| 20% | 19.9% | 290,110 | 289,116 |
| 10% | 10.0% | 145,055 | 145,043 |
| Active Idle | 0 | 0 | |
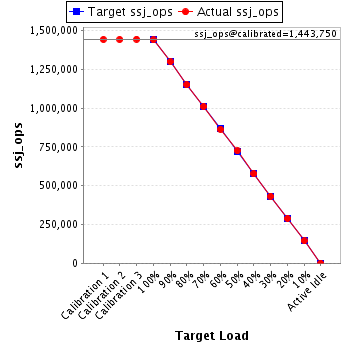
| Target Load | Actual Load | ssj_ops | |
|---|---|---|---|
| Target | Actual | ||
| Calibration 1 | 1,442,820 | ||
| Calibration 2 | 1,442,573 | ||
| Calibration 3 | 1,444,927 | ||
| ssj_ops@calibrated=1,443,750 | |||
| 100% | 99.7% | 1,443,750 | 1,439,865 |
| 90% | 90.0% | 1,299,375 | 1,299,273 |
| 80% | 79.7% | 1,155,000 | 1,151,382 |
| 70% | 70.0% | 1,010,625 | 1,011,301 |
| 60% | 59.9% | 866,250 | 864,253 |
| 50% | 50.2% | 721,875 | 724,871 |
| 40% | 39.9% | 577,500 | 576,242 |
| 30% | 30.0% | 433,125 | 432,879 |
| 20% | 20.0% | 288,750 | 288,361 |
| 10% | 10.0% | 144,375 | 144,172 |
| Active Idle | 0 | 0 | |
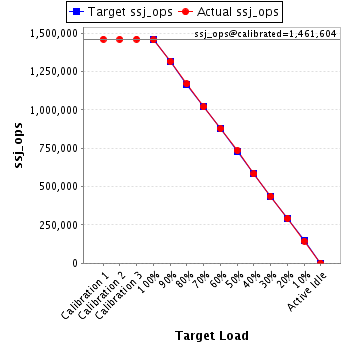
| Target Load | Actual Load | ssj_ops | |
|---|---|---|---|
| Target | Actual | ||
| Calibration 1 | 1,461,717 | ||
| Calibration 2 | 1,461,122 | ||
| Calibration 3 | 1,462,085 | ||
| ssj_ops@calibrated=1,461,604 | |||
| 100% | 99.7% | 1,461,604 | 1,457,030 |
| 90% | 90.1% | 1,315,443 | 1,317,147 |
| 80% | 80.1% | 1,169,283 | 1,170,546 |
| 70% | 69.8% | 1,023,123 | 1,020,460 |
| 60% | 60.1% | 876,962 | 878,806 |
| 50% | 50.3% | 730,802 | 735,088 |
| 40% | 39.9% | 584,641 | 582,453 |
| 30% | 30.0% | 438,481 | 438,191 |
| 20% | 20.0% | 292,321 | 292,815 |
| 10% | 9.9% | 146,160 | 144,465 |
| Active Idle | 0 | 0 | |
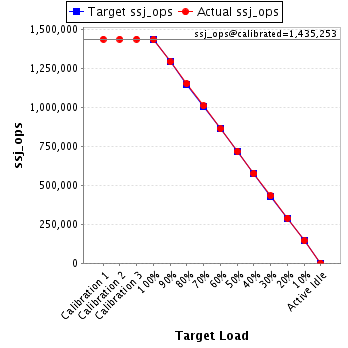
| Target Load | Actual Load | ssj_ops | |
|---|---|---|---|
| Target | Actual | ||
| Calibration 1 | 1,434,854 | ||
| Calibration 2 | 1,434,832 | ||
| Calibration 3 | 1,435,674 | ||
| ssj_ops@calibrated=1,435,253 | |||
| 100% | 99.8% | 1,435,253 | 1,432,949 |
| 90% | 89.9% | 1,291,728 | 1,290,676 |
| 80% | 80.2% | 1,148,202 | 1,150,590 |
| 70% | 70.2% | 1,004,677 | 1,008,209 |
| 60% | 60.0% | 861,152 | 860,903 |
| 50% | 50.0% | 717,626 | 717,072 |
| 40% | 40.0% | 574,101 | 574,323 |
| 30% | 30.0% | 430,576 | 431,088 |
| 20% | 20.2% | 287,051 | 289,693 |
| 10% | 10.1% | 143,525 | 145,242 |
| Active Idle | 0 | 0 | |
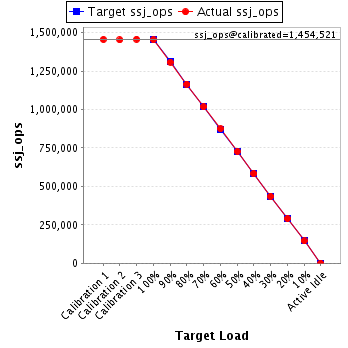
| Target Load | Actual Load | ssj_ops | |
|---|---|---|---|
| Target | Actual | ||
| Calibration 1 | 1,455,383 | ||
| Calibration 2 | 1,451,823 | ||
| Calibration 3 | 1,457,218 | ||
| ssj_ops@calibrated=1,454,521 | |||
| 100% | 99.9% | 1,454,521 | 1,452,563 |
| 90% | 89.9% | 1,309,069 | 1,307,806 |
| 80% | 80.1% | 1,163,617 | 1,165,152 |
| 70% | 69.9% | 1,018,164 | 1,016,746 |
| 60% | 60.1% | 872,712 | 874,195 |
| 50% | 50.0% | 727,260 | 726,790 |
| 40% | 40.0% | 581,808 | 582,290 |
| 30% | 30.0% | 436,356 | 435,990 |
| 20% | 19.9% | 290,904 | 289,299 |
| 10% | 10.0% | 145,452 | 144,949 |
| Active Idle | 0 | 0 | |
| Target Load | Actual Load | ssj_ops | |
|---|---|---|---|
| Target | Actual | ||
| Calibration 1 | 1,433,761 | ||
| Calibration 2 | 1,431,520 | ||
| Calibration 3 | 1,434,809 | ||
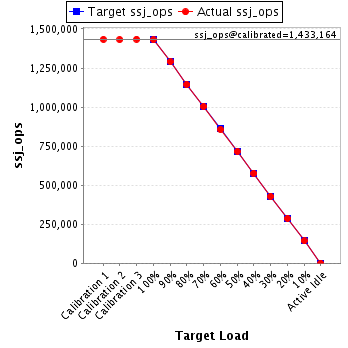
| ssj_ops@calibrated=1,433,164 | |||
| 100% | 99.8% | 1,433,164 | 1,430,225 |
| 90% | 90.0% | 1,289,848 | 1,290,343 |
| 80% | 79.8% | 1,146,532 | 1,144,328 |
| 70% | 70.1% | 1,003,215 | 1,004,840 |
| 60% | 59.7% | 859,899 | 856,205 |
| 50% | 49.9% | 716,582 | 715,504 |
| 40% | 40.2% | 573,266 | 575,780 |
| 30% | 29.9% | 429,949 | 428,469 |
| 20% | 20.0% | 286,633 | 286,964 |
| 10% | 10.0% | 143,316 | 143,004 |
| Active Idle | 0 | 0 | |
| Target Load | Actual Load | ssj_ops | |
|---|---|---|---|
| Target | Actual | ||
| Calibration 1 | 1,466,582 | ||
| Calibration 2 | 1,465,949 | ||
| Calibration 3 | 1,469,418 | ||
| ssj_ops@calibrated=1,467,683 | |||
| 100% | 99.8% | 1,467,683 | 1,465,063 |
| 90% | 89.9% | 1,320,915 | 1,320,164 |
| 80% | 80.2% | 1,174,147 | 1,176,480 |
| 70% | 69.9% | 1,027,378 | 1,025,961 |
| 60% | 60.0% | 880,610 | 880,842 |
| 50% | 50.0% | 733,842 | 734,316 |
| 40% | 39.9% | 587,073 | 585,014 |
| 30% | 30.0% | 440,305 | 440,277 |
| 20% | 19.9% | 293,537 | 291,359 |
| 10% | 10.0% | 146,768 | 147,402 |
| Active Idle | 0 | 0 | |

| Target Load | Actual Load | ssj_ops | |
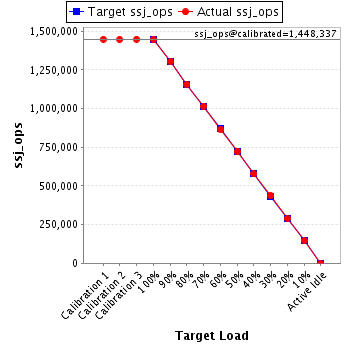
|---|---|---|---|
| Target | Actual | ||
| Calibration 1 | 1,448,546 | ||
| Calibration 2 | 1,447,326 | ||
| Calibration 3 | 1,449,348 | ||
| ssj_ops@calibrated=1,448,337 | |||
| 100% | 99.9% | 1,448,337 | 1,446,449 |
| 90% | 90.1% | 1,303,504 | 1,304,340 |
| 80% | 80.0% | 1,158,670 | 1,158,602 |
| 70% | 70.1% | 1,013,836 | 1,015,943 |
| 60% | 59.9% | 869,002 | 866,996 |
| 50% | 49.8% | 724,169 | 721,697 |
| 40% | 39.9% | 579,335 | 577,567 |
| 30% | 30.1% | 434,501 | 436,165 |
| 20% | 20.0% | 289,667 | 289,233 |
| 10% | 10.1% | 144,834 | 145,816 |
| Active Idle | 0 | 0 | |