SPECpower_ssj2008
Host 'SY480-07' Performance Report
Copyright © 2007-2019 Standard Performance Evaluation Corporation
| Hewlett Packard Enterprise Synergy 480 Gen10 Compute Module | ssj_ops@100% = 5,951,111 ssj_ops@100% per JVM = 1,487,778 |
||||
| Test Sponsor: | Hewlett Packard Enterprise | SPEC License #: | 3 | Test Method: | Multi Node |
| Tested By: | Hewlett Packard Enterprise | Test Location: | Houston, TX, USA | Test Date: | Mar 12, 2019 |
| Hardware Availability: | Apr-2019 | Software Availability: | Mar-2019 | Publication: | Apr 2, 2019 |
| System Source: | Single Supplier | System Designation: | Server | Power Provisioning: | Line-powered |
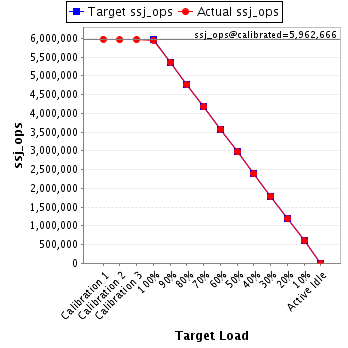
| Target Load | Actual Load | ssj_ops | |
|---|---|---|---|
| Target | Actual | ||
| Calibration 1 | 5,976,519 | ||
| Calibration 2 | 5,958,086 | ||
| Calibration 3 | 5,967,246 | ||
| ssj_ops@calibrated=5,962,666 | |||
| 100% | 99.8% | 5,962,666 | 5,951,111 |
| 90% | 89.9% | 5,366,399 | 5,363,389 |
| 80% | 79.9% | 4,770,133 | 4,766,995 |
| 70% | 70.0% | 4,173,866 | 4,173,277 |
| 60% | 60.0% | 3,577,600 | 3,576,817 |
| 50% | 49.8% | 2,981,333 | 2,970,770 |
| 40% | 40.0% | 2,385,066 | 2,383,930 |
| 30% | 29.9% | 1,788,800 | 1,785,515 |
| 20% | 20.0% | 1,192,533 | 1,190,019 |
| 10% | 10.0% | 596,267 | 597,831 |
| Active Idle | 0 | 0 | |
| Set Identifier: | SUT |
| Set Description: | System Under Test |
| # of Identical Nodes: | 12 |
| Comment: | SUT |
| Hardware | |
|---|---|
| Hardware Vendor: | Hewlett Packard Enterprise |
| Model: | Synergy 480 Gen10 Compute Module |
| Form Factor: | blade |
| CPU Name: | Intel Xeon Platinum 8280 @ 2.70GHz |
| CPU Characteristics: | 28-Core, 2.70 GHz, 38.5MB L3 Cache |
| CPU Frequency (MHz): | 2700 |
| CPU(s) Enabled: | 56 cores, 2 chips, 28 cores/chip |
| Hardware Threads: | 112 (2 / core) |
| CPU(s) Orderable: | 1,2 chips |
| Primary Cache: | 32 KB I + 32 KB D on chip per core |
| Secondary Cache: | 1 MB I+D on chip per core |
| Tertiary Cache: | 39424 KB I+D on chip per chip |
| Other Cache: | None |
| Memory Amount (GB): | 192 |
| # and size of DIMM: | 12 x 16384 MB |
| Memory Details: | 12 x 16GB 2Rx8 PC4-2933Y-R; slots 1, 3, 5, 8, 10 and 12 populated on each socket |
| Power Supply Quantity and Rating (W): | None |
| Power Supply Details: | N/A |
| Disk Drive: | 1 x HPE 480GB SATA 6G M.2 2280 (875498-B21) |
| Disk Controller: | HPE Smart Array S100i SR Gen10 |
| # and type of Network Interface Cards (NICs) Installed: | 1 x HPE Synergy 3820C 10/20Gb CNA |
| NICs Enabled in Firmware / OS / Connected: | 2/2/1 |
| Network Speed (Mbit): | 1000 |
| Keyboard: | None |
| Mouse: | None |
| Monitor: | None |
| Optical Drives: | No |
| Other Hardware: | None |
| Software | |
|---|---|
| Power Management: | Enabled (see SUT Notes) |
| Operating System (OS): | SUSE Linux Enterprise Server 12 SP4 |
| OS Version: | 4.12.14-94.41-default |
| Filesystem: | xfs |
| JVM Vendor: | Oracle Corporation |
| JVM Version: | Oracle Java HotSpot(TM) 64-Bit Server VM (build 24.80-b11, mixed mode), version 1.7.0_80 |
| JVM Command-line Options: | -server -Xmn19g -Xms21g -Xmx21g -XX:SurvivorRatio=1 -XX:TargetSurvivorRatio=99 -XX:AllocatePrefetchDistance=384 -XX:AllocatePrefetchLines=4 -XX:LoopUnrollLimit=37 -XX:InitialTenuringThreshold=12 -XX:MaxTenuringThreshold=15 -XX:ParallelGCThreads=28 -XX:InlineSmallCode=3900 -XX:MaxInlineSize=270 -XX:FreqInlineSize=2500 -XX:+AggressiveOpts -XX:+UseLargePages -XX:+UseParallelOldGC |
| JVM Affinity: | numactl --cpunodebind=[0-3] --localalloc |
| JVM Instances: | 4 |
| JVM Initial Heap (MB): | 21000 |
| JVM Maximum Heap (MB): | 21000 |
| JVM Address Bits: | 64 |
| Boot Firmware Version: | I42 v2.00 (02/02/2019) |
| Management Firmware Version: | 1.40 Feb 05 2019 |
| Workload Version: | SSJ 1.2.10 |
| Director Location: | Controller |
| Other Software: | HPE Service Pack for ProLiant (SPP) - Version 2019.03.0 (Mar 2019) |
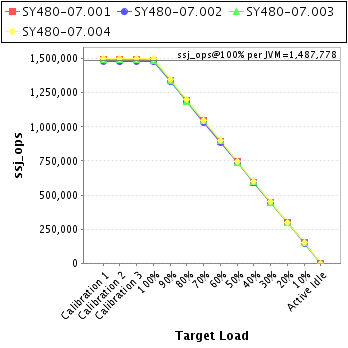
| JVM Instance | ssj_ops@100% |
|---|---|
| SY480-07.001 | 1,489,809 |
| SY480-07.002 | 1,477,597 |
| SY480-07.003 | 1,486,455 |
| SY480-07.004 | 1,497,249 |
| ssj_ops@100% | 5,951,111 |
| ssj_ops@100% per JVM | 1,487,778 |
| Target Load | Actual Load | ssj_ops | |
|---|---|---|---|
| Target | Actual | ||
| Calibration 1 | 1,497,189 | ||
| Calibration 2 | 1,492,649 | ||
| Calibration 3 | 1,494,043 | ||
| ssj_ops@calibrated=1,493,346 | |||
| 100% | 99.8% | 1,493,346 | 1,489,809 |
| 90% | 89.9% | 1,344,012 | 1,342,767 |
| 80% | 80.0% | 1,194,677 | 1,194,018 |
| 70% | 70.0% | 1,045,342 | 1,044,744 |
| 60% | 59.9% | 896,008 | 895,105 |
| 50% | 49.8% | 746,673 | 743,748 |
| 40% | 39.9% | 597,338 | 595,496 |
| 30% | 29.9% | 448,004 | 446,690 |
| 20% | 19.9% | 298,669 | 297,066 |
| 10% | 10.1% | 149,335 | 150,647 |
| Active Idle | 0 | 0 | |
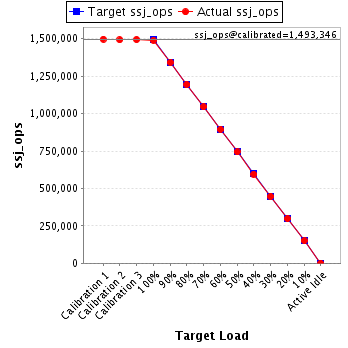
| Target Load | Actual Load | ssj_ops | |
|---|---|---|---|
| Target | Actual | ||
| Calibration 1 | 1,481,348 | ||
| Calibration 2 | 1,476,406 | ||
| Calibration 3 | 1,479,486 | ||
| ssj_ops@calibrated=1,477,946 | |||
| 100% | 100.0% | 1,477,946 | 1,477,597 |
| 90% | 90.0% | 1,330,151 | 1,330,729 |
| 80% | 80.1% | 1,182,357 | 1,184,020 |
| 70% | 69.9% | 1,034,562 | 1,032,967 |
| 60% | 60.0% | 886,768 | 886,615 |
| 50% | 50.0% | 738,973 | 739,146 |
| 40% | 40.0% | 591,178 | 591,764 |
| 30% | 29.9% | 443,384 | 442,454 |
| 20% | 20.0% | 295,589 | 296,044 |
| 10% | 10.0% | 147,795 | 147,354 |
| Active Idle | 0 | 0 | |

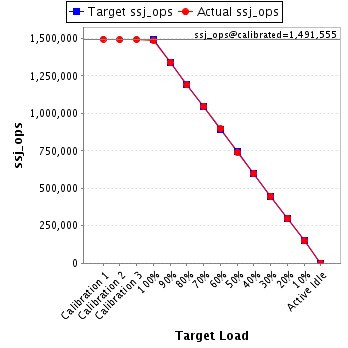
| Target Load | Actual Load | ssj_ops | |
|---|---|---|---|
| Target | Actual | ||
| Calibration 1 | 1,494,748 | ||
| Calibration 2 | 1,490,962 | ||
| Calibration 3 | 1,492,149 | ||
| ssj_ops@calibrated=1,491,555 | |||
| 100% | 99.7% | 1,491,555 | 1,486,455 |
| 90% | 89.8% | 1,342,400 | 1,339,791 |
| 80% | 79.7% | 1,193,244 | 1,189,170 |
| 70% | 70.2% | 1,044,089 | 1,046,440 |
| 60% | 60.1% | 894,933 | 896,566 |
| 50% | 49.7% | 745,778 | 740,926 |
| 40% | 40.0% | 596,622 | 597,196 |
| 30% | 29.9% | 447,467 | 446,653 |
| 20% | 19.9% | 298,311 | 296,214 |
| 10% | 10.0% | 149,156 | 149,343 |
| Active Idle | 0 | 0 | |
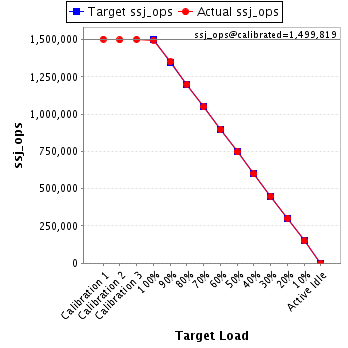
| Target Load | Actual Load | ssj_ops | |
|---|---|---|---|
| Target | Actual | ||
| Calibration 1 | 1,503,235 | ||
| Calibration 2 | 1,498,069 | ||
| Calibration 3 | 1,501,568 | ||
| ssj_ops@calibrated=1,499,819 | |||
| 100% | 99.8% | 1,499,819 | 1,497,249 |
| 90% | 90.0% | 1,349,837 | 1,350,102 |
| 80% | 80.0% | 1,199,855 | 1,199,787 |
| 70% | 70.0% | 1,049,873 | 1,049,125 |
| 60% | 59.9% | 899,891 | 898,530 |
| 50% | 49.8% | 749,909 | 746,951 |
| 40% | 40.0% | 599,927 | 599,475 |
| 30% | 30.0% | 449,946 | 449,717 |
| 20% | 20.0% | 299,964 | 300,695 |
| 10% | 10.0% | 149,982 | 150,487 |
| Active Idle | 0 | 0 | |