
SPECpower_ssj2008
Host 'SY480-08' Performance Report
Copyright © 2007-2019 Standard Performance Evaluation Corporation
| Hewlett Packard Enterprise Synergy 480 Gen10 Compute Module | ssj_ops@100% = 5,920,670 ssj_ops@100% per JVM = 1,480,167 |
||||
| Test Sponsor: | Hewlett Packard Enterprise | SPEC License #: | 3 | Test Method: | Multi Node |
| Tested By: | Hewlett Packard Enterprise | Test Location: | Houston, TX, USA | Test Date: | Mar 12, 2019 |
| Hardware Availability: | Apr-2019 | Software Availability: | Mar-2019 | Publication: | Apr 2, 2019 |
| System Source: | Single Supplier | System Designation: | Server | Power Provisioning: | Line-powered |
| Target Load | Actual Load | ssj_ops | |
|---|---|---|---|
| Target | Actual | ||
| Calibration 1 | 5,953,074 | ||
| Calibration 2 | 5,942,681 | ||
| Calibration 3 | 5,935,150 | ||
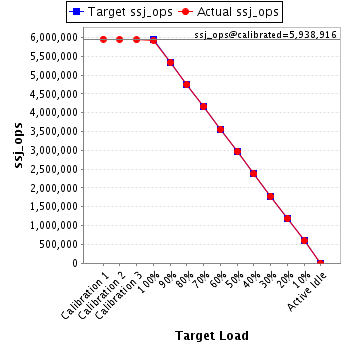
| ssj_ops@calibrated=5,938,916 | |||
| 100% | 99.7% | 5,938,916 | 5,920,670 |
| 90% | 89.9% | 5,345,024 | 5,336,496 |
| 80% | 79.9% | 4,751,133 | 4,746,875 |
| 70% | 70.2% | 4,157,241 | 4,166,263 |
| 60% | 59.9% | 3,563,349 | 3,559,517 |
| 50% | 50.0% | 2,969,458 | 2,970,829 |
| 40% | 39.9% | 2,375,566 | 2,371,424 |
| 30% | 30.0% | 1,781,675 | 1,782,336 |
| 20% | 20.0% | 1,187,783 | 1,188,371 |
| 10% | 10.0% | 593,892 | 594,264 |
| Active Idle | 0 | 0 | |
| Set Identifier: | SUT |
| Set Description: | System Under Test |
| # of Identical Nodes: | 12 |
| Comment: | SUT |
| Hardware | |
|---|---|
| Hardware Vendor: | Hewlett Packard Enterprise |
| Model: | Synergy 480 Gen10 Compute Module |
| Form Factor: | blade |
| CPU Name: | Intel Xeon Platinum 8280 @ 2.70GHz |
| CPU Characteristics: | 28-Core, 2.70 GHz, 38.5MB L3 Cache |
| CPU Frequency (MHz): | 2700 |
| CPU(s) Enabled: | 56 cores, 2 chips, 28 cores/chip |
| Hardware Threads: | 112 (2 / core) |
| CPU(s) Orderable: | 1,2 chips |
| Primary Cache: | 32 KB I + 32 KB D on chip per core |
| Secondary Cache: | 1 MB I+D on chip per core |
| Tertiary Cache: | 39424 KB I+D on chip per chip |
| Other Cache: | None |
| Memory Amount (GB): | 192 |
| # and size of DIMM: | 12 x 16384 MB |
| Memory Details: | 12 x 16GB 2Rx8 PC4-2933Y-R; slots 1, 3, 5, 8, 10 and 12 populated on each socket |
| Power Supply Quantity and Rating (W): | None |
| Power Supply Details: | N/A |
| Disk Drive: | 1 x HPE 480GB SATA 6G M.2 2280 (875498-B21) |
| Disk Controller: | HPE Smart Array S100i SR Gen10 |
| # and type of Network Interface Cards (NICs) Installed: | 1 x HPE Synergy 3820C 10/20Gb CNA |
| NICs Enabled in Firmware / OS / Connected: | 2/2/1 |
| Network Speed (Mbit): | 1000 |
| Keyboard: | None |
| Mouse: | None |
| Monitor: | None |
| Optical Drives: | No |
| Other Hardware: | None |
| Software | |
|---|---|
| Power Management: | Enabled (see SUT Notes) |
| Operating System (OS): | SUSE Linux Enterprise Server 12 SP4 |
| OS Version: | 4.12.14-94.41-default |
| Filesystem: | xfs |
| JVM Vendor: | Oracle Corporation |
| JVM Version: | Oracle Java HotSpot(TM) 64-Bit Server VM (build 24.80-b11, mixed mode), version 1.7.0_80 |
| JVM Command-line Options: | -server -Xmn19g -Xms21g -Xmx21g -XX:SurvivorRatio=1 -XX:TargetSurvivorRatio=99 -XX:AllocatePrefetchDistance=384 -XX:AllocatePrefetchLines=4 -XX:LoopUnrollLimit=37 -XX:InitialTenuringThreshold=12 -XX:MaxTenuringThreshold=15 -XX:ParallelGCThreads=28 -XX:InlineSmallCode=3900 -XX:MaxInlineSize=270 -XX:FreqInlineSize=2500 -XX:+AggressiveOpts -XX:+UseLargePages -XX:+UseParallelOldGC |
| JVM Affinity: | numactl --cpunodebind=[0-3] --localalloc |
| JVM Instances: | 4 |
| JVM Initial Heap (MB): | 21000 |
| JVM Maximum Heap (MB): | 21000 |
| JVM Address Bits: | 64 |
| Boot Firmware Version: | I42 v2.00 (02/02/2019) |
| Management Firmware Version: | 1.40 Feb 05 2019 |
| Workload Version: | SSJ 1.2.10 |
| Director Location: | Controller |
| Other Software: | HPE Service Pack for ProLiant (SPP) - Version 2019.03.0 (Mar 2019) |
| JVM Instance | ssj_ops@100% |
|---|---|
| SY480-08.001 | 1,488,231 |
| SY480-08.002 | 1,479,379 |
| SY480-08.003 | 1,468,007 |
| SY480-08.004 | 1,485,052 |
| ssj_ops@100% | 5,920,670 |
| ssj_ops@100% per JVM | 1,480,167 |

| Target Load | Actual Load | ssj_ops | |
|---|---|---|---|
| Target | Actual | ||
| Calibration 1 | 1,496,714 | ||
| Calibration 2 | 1,495,320 | ||
| Calibration 3 | 1,490,164 | ||
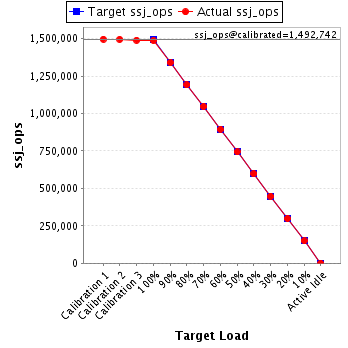
| ssj_ops@calibrated=1,492,742 | |||
| 100% | 99.7% | 1,492,742 | 1,488,231 |
| 90% | 89.8% | 1,343,467 | 1,340,644 |
| 80% | 79.8% | 1,194,193 | 1,191,369 |
| 70% | 70.2% | 1,044,919 | 1,048,231 |
| 60% | 60.0% | 895,645 | 895,705 |
| 50% | 49.8% | 746,371 | 743,271 |
| 40% | 40.0% | 597,097 | 597,103 |
| 30% | 30.0% | 447,822 | 448,190 |
| 20% | 20.0% | 298,548 | 298,142 |
| 10% | 10.0% | 149,274 | 149,744 |
| Active Idle | 0 | 0 | |
| Target Load | Actual Load | ssj_ops | |
|---|---|---|---|
| Target | Actual | ||
| Calibration 1 | 1,487,535 | ||
| Calibration 2 | 1,482,832 | ||
| Calibration 3 | 1,484,757 | ||
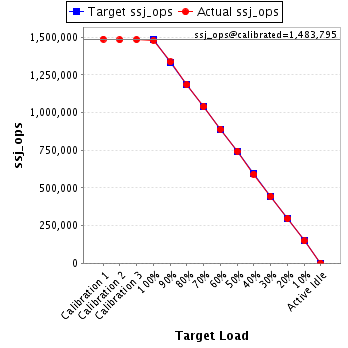
| ssj_ops@calibrated=1,483,795 | |||
| 100% | 99.7% | 1,483,795 | 1,479,379 |
| 90% | 90.0% | 1,335,415 | 1,336,052 |
| 80% | 79.8% | 1,187,036 | 1,184,773 |
| 70% | 70.1% | 1,038,656 | 1,039,497 |
| 60% | 60.0% | 890,277 | 890,298 |
| 50% | 50.1% | 741,897 | 743,819 |
| 40% | 39.8% | 593,518 | 591,282 |
| 30% | 30.0% | 445,138 | 444,595 |
| 20% | 20.0% | 296,759 | 296,165 |
| 10% | 10.0% | 148,379 | 148,475 |
| Active Idle | 0 | 0 | |
| Target Load | Actual Load | ssj_ops | |
|---|---|---|---|
| Target | Actual | ||
| Calibration 1 | 1,478,071 | ||
| Calibration 2 | 1,476,356 | ||
| Calibration 3 | 1,471,245 | ||
| ssj_ops@calibrated=1,473,800 | |||
| 100% | 99.6% | 1,473,800 | 1,468,007 |
| 90% | 89.8% | 1,326,420 | 1,322,905 |
| 80% | 80.0% | 1,179,040 | 1,178,568 |
| 70% | 70.0% | 1,031,660 | 1,031,309 |
| 60% | 60.0% | 884,280 | 883,952 |
| 50% | 50.1% | 736,900 | 738,111 |
| 40% | 40.0% | 589,520 | 589,006 |
| 30% | 29.9% | 442,140 | 441,028 |
| 20% | 20.1% | 294,760 | 295,536 |
| 10% | 10.0% | 147,380 | 147,502 |
| Active Idle | 0 | 0 | |

| Target Load | Actual Load | ssj_ops | |
|---|---|---|---|
| Target | Actual | ||
| Calibration 1 | 1,490,754 | ||
| Calibration 2 | 1,488,174 | ||
| Calibration 3 | 1,488,984 | ||
| ssj_ops@calibrated=1,488,579 | |||
| 100% | 99.8% | 1,488,579 | 1,485,052 |
| 90% | 89.8% | 1,339,721 | 1,336,894 |
| 80% | 80.1% | 1,190,863 | 1,192,166 |
| 70% | 70.4% | 1,042,005 | 1,047,226 |
| 60% | 59.8% | 893,147 | 889,561 |
| 50% | 50.1% | 744,289 | 745,628 |
| 40% | 39.9% | 595,432 | 594,033 |
| 30% | 30.1% | 446,574 | 448,523 |
| 20% | 20.1% | 297,716 | 298,528 |
| 10% | 10.0% | 148,858 | 148,542 |
| Active Idle | 0 | 0 | |
