
SPECpower_ssj2008
Host 'SY480-12' Performance Report
Copyright © 2007-2019 Standard Performance Evaluation Corporation
| Hewlett Packard Enterprise Synergy 480 Gen10 Compute Module | ssj_ops@100% = 5,948,308 ssj_ops@100% per JVM = 1,487,077 |
||||
| Test Sponsor: | Hewlett Packard Enterprise | SPEC License #: | 3 | Test Method: | Multi Node |
| Tested By: | Hewlett Packard Enterprise | Test Location: | Houston, TX, USA | Test Date: | Mar 12, 2019 |
| Hardware Availability: | Apr-2019 | Software Availability: | Mar-2019 | Publication: | Apr 2, 2019 |
| System Source: | Single Supplier | System Designation: | Server | Power Provisioning: | Line-powered |
| Target Load | Actual Load | ssj_ops | |
|---|---|---|---|
| Target | Actual | ||
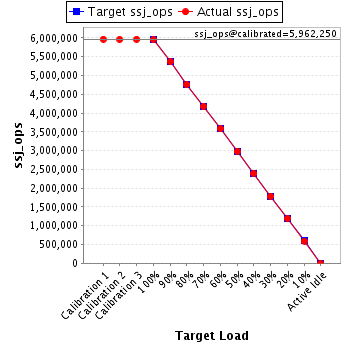
| Calibration 1 | 5,967,560 | ||
| Calibration 2 | 5,957,306 | ||
| Calibration 3 | 5,967,195 | ||
| ssj_ops@calibrated=5,962,250 | |||
| 100% | 99.8% | 5,962,250 | 5,948,308 |
| 90% | 90.0% | 5,366,025 | 5,367,070 |
| 80% | 79.9% | 4,769,800 | 4,764,790 |
| 70% | 70.1% | 4,173,575 | 4,182,094 |
| 60% | 60.1% | 3,577,350 | 3,582,020 |
| 50% | 50.0% | 2,981,125 | 2,981,421 |
| 40% | 40.1% | 2,384,900 | 2,390,902 |
| 30% | 30.0% | 1,788,675 | 1,788,943 |
| 20% | 20.0% | 1,192,450 | 1,195,422 |
| 10% | 9.9% | 596,225 | 592,566 |
| Active Idle | 0 | 0 | |
| Set Identifier: | SUT |
| Set Description: | System Under Test |
| # of Identical Nodes: | 12 |
| Comment: | SUT |
| Hardware | |
|---|---|
| Hardware Vendor: | Hewlett Packard Enterprise |
| Model: | Synergy 480 Gen10 Compute Module |
| Form Factor: | blade |
| CPU Name: | Intel Xeon Platinum 8280 @ 2.70GHz |
| CPU Characteristics: | 28-Core, 2.70 GHz, 38.5MB L3 Cache |
| CPU Frequency (MHz): | 2700 |
| CPU(s) Enabled: | 56 cores, 2 chips, 28 cores/chip |
| Hardware Threads: | 112 (2 / core) |
| CPU(s) Orderable: | 1,2 chips |
| Primary Cache: | 32 KB I + 32 KB D on chip per core |
| Secondary Cache: | 1 MB I+D on chip per core |
| Tertiary Cache: | 39424 KB I+D on chip per chip |
| Other Cache: | None |
| Memory Amount (GB): | 192 |
| # and size of DIMM: | 12 x 16384 MB |
| Memory Details: | 12 x 16GB 2Rx8 PC4-2933Y-R; slots 1, 3, 5, 8, 10 and 12 populated on each socket |
| Power Supply Quantity and Rating (W): | None |
| Power Supply Details: | N/A |
| Disk Drive: | 1 x HPE 480GB SATA 6G M.2 2280 (875498-B21) |
| Disk Controller: | HPE Smart Array S100i SR Gen10 |
| # and type of Network Interface Cards (NICs) Installed: | 1 x HPE Synergy 3820C 10/20Gb CNA |
| NICs Enabled in Firmware / OS / Connected: | 2/2/1 |
| Network Speed (Mbit): | 1000 |
| Keyboard: | None |
| Mouse: | None |
| Monitor: | None |
| Optical Drives: | No |
| Other Hardware: | None |
| Software | |
|---|---|
| Power Management: | Enabled (see SUT Notes) |
| Operating System (OS): | SUSE Linux Enterprise Server 12 SP4 |
| OS Version: | 4.12.14-94.41-default |
| Filesystem: | xfs |
| JVM Vendor: | Oracle Corporation |
| JVM Version: | Oracle Java HotSpot(TM) 64-Bit Server VM (build 24.80-b11, mixed mode), version 1.7.0_80 |
| JVM Command-line Options: | -server -Xmn19g -Xms21g -Xmx21g -XX:SurvivorRatio=1 -XX:TargetSurvivorRatio=99 -XX:AllocatePrefetchDistance=384 -XX:AllocatePrefetchLines=4 -XX:LoopUnrollLimit=37 -XX:InitialTenuringThreshold=12 -XX:MaxTenuringThreshold=15 -XX:ParallelGCThreads=28 -XX:InlineSmallCode=3900 -XX:MaxInlineSize=270 -XX:FreqInlineSize=2500 -XX:+AggressiveOpts -XX:+UseLargePages -XX:+UseParallelOldGC |
| JVM Affinity: | numactl --cpunodebind=[0-3] --localalloc |
| JVM Instances: | 4 |
| JVM Initial Heap (MB): | 21000 |
| JVM Maximum Heap (MB): | 21000 |
| JVM Address Bits: | 64 |
| Boot Firmware Version: | I42 v2.00 (02/02/2019) |
| Management Firmware Version: | 1.40 Feb 05 2019 |
| Workload Version: | SSJ 1.2.10 |
| Director Location: | Controller |
| Other Software: | HPE Service Pack for ProLiant (SPP) - Version 2019.03.0 (Mar 2019) |
| JVM Instance | ssj_ops@100% |
|---|---|
| SY480-12.001 | 1,476,259 |
| SY480-12.002 | 1,485,531 |
| SY480-12.003 | 1,503,519 |
| SY480-12.004 | 1,482,999 |
| ssj_ops@100% | 5,948,308 |
| ssj_ops@100% per JVM | 1,487,077 |

| Target Load | Actual Load | ssj_ops | |
|---|---|---|---|
| Target | Actual | ||
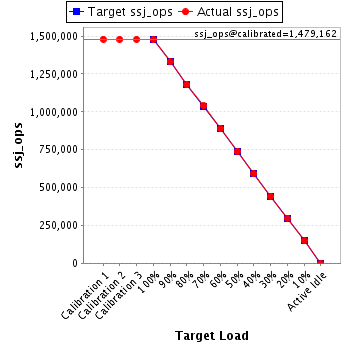
| Calibration 1 | 1,479,994 | ||
| Calibration 2 | 1,478,977 | ||
| Calibration 3 | 1,479,347 | ||
| ssj_ops@calibrated=1,479,162 | |||
| 100% | 99.8% | 1,479,162 | 1,476,259 |
| 90% | 89.9% | 1,331,246 | 1,329,516 |
| 80% | 79.9% | 1,183,330 | 1,181,139 |
| 70% | 70.2% | 1,035,413 | 1,038,849 |
| 60% | 60.2% | 887,497 | 890,221 |
| 50% | 49.9% | 739,581 | 738,824 |
| 40% | 40.0% | 591,665 | 592,188 |
| 30% | 30.0% | 443,749 | 443,235 |
| 20% | 20.2% | 295,832 | 298,124 |
| 10% | 10.0% | 147,916 | 148,262 |
| Active Idle | 0 | 0 | |
| Target Load | Actual Load | ssj_ops | |
|---|---|---|---|
| Target | Actual | ||
| Calibration 1 | 1,490,121 | ||
| Calibration 2 | 1,486,407 | ||
| Calibration 3 | 1,486,978 | ||
| ssj_ops@calibrated=1,486,692 | |||
| 100% | 99.9% | 1,486,692 | 1,485,531 |
| 90% | 89.9% | 1,338,023 | 1,336,863 |
| 80% | 80.0% | 1,189,354 | 1,189,479 |
| 70% | 69.9% | 1,040,685 | 1,038,880 |
| 60% | 60.1% | 892,015 | 893,644 |
| 50% | 50.0% | 743,346 | 742,902 |
| 40% | 40.1% | 594,677 | 595,641 |
| 30% | 30.1% | 446,008 | 447,186 |
| 20% | 20.0% | 297,338 | 297,150 |
| 10% | 9.9% | 148,669 | 147,360 |
| Active Idle | 0 | 0 | |

| Target Load | Actual Load | ssj_ops | |
|---|---|---|---|
| Target | Actual | ||
| Calibration 1 | 1,510,091 | ||
| Calibration 2 | 1,508,810 | ||
| Calibration 3 | 1,511,605 | ||
| ssj_ops@calibrated=1,510,207 | |||
| 100% | 99.6% | 1,510,207 | 1,503,519 |
| 90% | 90.0% | 1,359,186 | 1,359,223 |
| 80% | 80.3% | 1,208,166 | 1,212,094 |
| 70% | 70.3% | 1,057,145 | 1,061,102 |
| 60% | 59.9% | 906,124 | 904,551 |
| 50% | 50.1% | 755,104 | 756,450 |
| 40% | 40.1% | 604,083 | 605,475 |
| 30% | 29.9% | 453,062 | 451,493 |
| 20% | 20.1% | 302,041 | 303,090 |
| 10% | 9.9% | 151,021 | 149,605 |
| Active Idle | 0 | 0 | |

| Target Load | Actual Load | ssj_ops | |
|---|---|---|---|
| Target | Actual | ||
| Calibration 1 | 1,487,354 | ||
| Calibration 2 | 1,483,113 | ||
| Calibration 3 | 1,489,266 | ||
| ssj_ops@calibrated=1,486,189 | |||
| 100% | 99.8% | 1,486,189 | 1,482,999 |
| 90% | 90.3% | 1,337,570 | 1,341,467 |
| 80% | 79.5% | 1,188,951 | 1,182,078 |
| 70% | 70.2% | 1,040,332 | 1,043,263 |
| 60% | 60.1% | 891,713 | 893,604 |
| 50% | 50.0% | 743,095 | 743,245 |
| 40% | 40.2% | 594,476 | 597,598 |
| 30% | 30.1% | 445,857 | 447,029 |
| 20% | 20.0% | 297,238 | 297,058 |
| 10% | 9.9% | 148,619 | 147,339 |
| Active Idle | 0 | 0 | |
