SPECpower_ssj2008
Host 'SY480-01' Performance Report
Copyright © 2007-2019 Standard Performance Evaluation Corporation
| Hewlett Packard Enterprise Synergy 480 Gen10 Compute Module | ssj_ops@100% = 5,957,554 ssj_ops@100% per JVM = 1,489,388 |
||||
| Test Sponsor: | Hewlett Packard Enterprise | SPEC License #: | 3 | Test Method: | Multi Node |
| Tested By: | Hewlett Packard Enterprise | Test Location: | Houston, TX, USA | Test Date: | Mar 12, 2019 |
| Hardware Availability: | Apr-2019 | Software Availability: | Mar-2019 | Publication: | Apr 2, 2019 |
| System Source: | Single Supplier | System Designation: | Server | Power Provisioning: | Line-powered |
| Target Load | Actual Load | ssj_ops | |
|---|---|---|---|
| Target | Actual | ||
| Calibration 1 | 5,988,912 | ||
| Calibration 2 | 5,973,658 | ||
| Calibration 3 | 5,976,499 | ||
| ssj_ops@calibrated=5,975,079 | |||
| 100% | 99.7% | 5,975,079 | 5,957,554 |
| 90% | 90.0% | 5,377,571 | 5,375,035 |
| 80% | 80.0% | 4,780,063 | 4,780,398 |
| 70% | 69.8% | 4,182,555 | 4,172,131 |
| 60% | 59.9% | 3,585,047 | 3,581,078 |
| 50% | 50.0% | 2,987,539 | 2,986,572 |
| 40% | 40.0% | 2,390,031 | 2,391,704 |
| 30% | 30.1% | 1,792,524 | 1,797,478 |
| 20% | 20.0% | 1,195,016 | 1,197,001 |
| 10% | 10.0% | 597,508 | 596,482 |
| Active Idle | 0 | 0 | |

| Set Identifier: | SUT |
| Set Description: | System Under Test |
| # of Identical Nodes: | 8 |
| Comment: | SUT |
| Hardware | |
|---|---|
| Hardware Vendor: | Hewlett Packard Enterprise |
| Model: | Synergy 480 Gen10 Compute Module |
| Form Factor: | blade |
| CPU Name: | Intel Xeon Platinum 8280 @ 2.70GHz |
| CPU Characteristics: | 28-Core, 2.70 GHz, 38.5MB L3 Cache |
| CPU Frequency (MHz): | 2700 |
| CPU(s) Enabled: | 56 cores, 2 chips, 28 cores/chip |
| Hardware Threads: | 112 (2 / core) |
| CPU(s) Orderable: | 1,2 chips |
| Primary Cache: | 32 KB I + 32 KB D on chip per core |
| Secondary Cache: | 1 MB I+D on chip per core |
| Tertiary Cache: | 39424 KB I+D on chip per chip |
| Other Cache: | None |
| Memory Amount (GB): | 192 |
| # and size of DIMM: | 12 x 16384 MB |
| Memory Details: | 12 x 16GB 2Rx8 PC4-2933Y-R; slots 1, 3, 5, 8, 10 and 12 populated on each socket |
| Power Supply Quantity and Rating (W): | None |
| Power Supply Details: | N/A |
| Disk Drive: | 1 x HPE 480GB SATA 6G M.2 2280 (875498-B21) |
| Disk Controller: | HPE Smart Array S100i SR Gen10 |
| # and type of Network Interface Cards (NICs) Installed: | 1 x HPE Synergy 3820C 10/20Gb CNA |
| NICs Enabled in Firmware / OS / Connected: | 2/2/1 |
| Network Speed (Mbit): | 1000 |
| Keyboard: | None |
| Mouse: | None |
| Monitor: | None |
| Optical Drives: | No |
| Other Hardware: | None |
| Software | |
|---|---|
| Power Management: | Enabled (see SUT Notes) |
| Operating System (OS): | SUSE Linux Enterprise Server 12 SP4 |
| OS Version: | 4.12.14-94.41-default |
| Filesystem: | xfs |
| JVM Vendor: | Oracle Corporation |
| JVM Version: | Oracle Java HotSpot(TM) 64-Bit Server VM (build 24.80-b11, mixed mode), version 1.7.0_80 |
| JVM Command-line Options: | -server -Xmn19g -Xms21g -Xmx21g -XX:SurvivorRatio=1 -XX:TargetSurvivorRatio=99 -XX:AllocatePrefetchDistance=384 -XX:AllocatePrefetchLines=4 -XX:LoopUnrollLimit=37 -XX:InitialTenuringThreshold=12 -XX:MaxTenuringThreshold=15 -XX:ParallelGCThreads=28 -XX:InlineSmallCode=3900 -XX:MaxInlineSize=270 -XX:FreqInlineSize=2500 -XX:+AggressiveOpts -XX:+UseLargePages -XX:+UseParallelOldGC |
| JVM Affinity: | numactl --cpunodebind=[0-3] --localalloc |
| JVM Instances: | 4 |
| JVM Initial Heap (MB): | 21000 |
| JVM Maximum Heap (MB): | 21000 |
| JVM Address Bits: | 64 |
| Boot Firmware Version: | I42 v2.00 (02/02/2019) |
| Management Firmware Version: | 1.40 Feb 05 2019 |
| Workload Version: | SSJ 1.2.10 |
| Director Location: | Controller |
| Other Software: | HPE Service Pack for ProLiant (SPP) - Version 2019.03.0 (Mar 2019) |
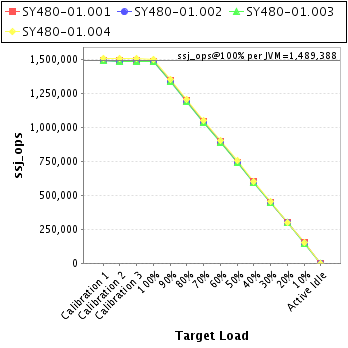
| JVM Instance | ssj_ops@100% |
|---|---|
| SY480-01.001 | 1,486,341 |
| SY480-01.002 | 1,485,761 |
| SY480-01.003 | 1,482,218 |
| SY480-01.004 | 1,503,233 |
| ssj_ops@100% | 5,957,554 |
| ssj_ops@100% per JVM | 1,489,388 |
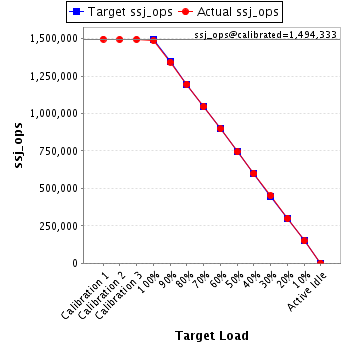
| Target Load | Actual Load | ssj_ops | |
|---|---|---|---|
| Target | Actual | ||
| Calibration 1 | 1,496,162 | ||
| Calibration 2 | 1,494,125 | ||
| Calibration 3 | 1,494,541 | ||
| ssj_ops@calibrated=1,494,333 | |||
| 100% | 99.5% | 1,494,333 | 1,486,341 |
| 90% | 89.9% | 1,344,900 | 1,343,253 |
| 80% | 80.0% | 1,195,466 | 1,194,764 |
| 70% | 70.0% | 1,046,033 | 1,045,449 |
| 60% | 60.0% | 896,600 | 896,841 |
| 50% | 49.8% | 747,166 | 744,009 |
| 40% | 40.1% | 597,733 | 598,875 |
| 30% | 30.2% | 448,300 | 450,755 |
| 20% | 20.1% | 298,867 | 299,749 |
| 10% | 10.0% | 149,433 | 149,510 |
| Active Idle | 0 | 0 | |
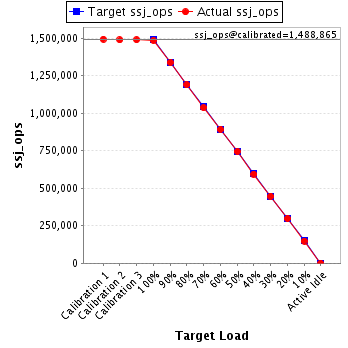
| Target Load | Actual Load | ssj_ops | |
|---|---|---|---|
| Target | Actual | ||
| Calibration 1 | 1,493,871 | ||
| Calibration 2 | 1,488,409 | ||
| Calibration 3 | 1,489,321 | ||
| ssj_ops@calibrated=1,488,865 | |||
| 100% | 99.8% | 1,488,865 | 1,485,761 |
| 90% | 90.0% | 1,339,979 | 1,339,464 |
| 80% | 79.9% | 1,191,092 | 1,190,035 |
| 70% | 69.6% | 1,042,206 | 1,036,319 |
| 60% | 60.0% | 893,319 | 893,162 |
| 50% | 50.1% | 744,433 | 745,326 |
| 40% | 39.9% | 595,546 | 594,632 |
| 30% | 30.1% | 446,660 | 447,563 |
| 20% | 20.0% | 297,773 | 297,550 |
| 10% | 10.0% | 148,887 | 148,145 |
| Active Idle | 0 | 0 | |
| Target Load | Actual Load | ssj_ops | |
|---|---|---|---|
| Target | Actual | ||
| Calibration 1 | 1,489,312 | ||
| Calibration 2 | 1,485,354 | ||
| Calibration 3 | 1,486,364 | ||
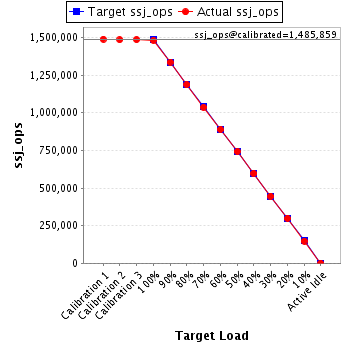
| ssj_ops@calibrated=1,485,859 | |||
| 100% | 99.8% | 1,485,859 | 1,482,218 |
| 90% | 90.0% | 1,337,273 | 1,337,240 |
| 80% | 79.9% | 1,188,688 | 1,187,107 |
| 70% | 69.8% | 1,040,102 | 1,037,688 |
| 60% | 59.9% | 891,516 | 889,433 |
| 50% | 50.0% | 742,930 | 743,069 |
| 40% | 40.1% | 594,344 | 596,401 |
| 30% | 30.0% | 445,758 | 445,943 |
| 20% | 20.1% | 297,172 | 299,089 |
| 10% | 9.9% | 148,586 | 147,387 |
| Active Idle | 0 | 0 | |
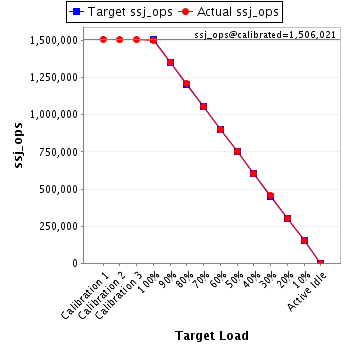
| Target Load | Actual Load | ssj_ops | |
|---|---|---|---|
| Target | Actual | ||
| Calibration 1 | 1,509,567 | ||
| Calibration 2 | 1,505,770 | ||
| Calibration 3 | 1,506,273 | ||
| ssj_ops@calibrated=1,506,021 | |||
| 100% | 99.8% | 1,506,021 | 1,503,233 |
| 90% | 90.0% | 1,355,419 | 1,355,079 |
| 80% | 80.2% | 1,204,817 | 1,208,491 |
| 70% | 69.9% | 1,054,215 | 1,052,676 |
| 60% | 59.9% | 903,613 | 901,642 |
| 50% | 50.1% | 753,011 | 754,168 |
| 40% | 40.0% | 602,409 | 601,795 |
| 30% | 30.1% | 451,806 | 453,218 |
| 20% | 20.0% | 301,204 | 300,612 |
| 10% | 10.1% | 150,602 | 151,439 |
| Active Idle | 0 | 0 | |