SPECpower_ssj2008
Host 'SY480-08' Performance Report
Copyright © 2007-2019 Standard Performance Evaluation Corporation
| Hewlett Packard Enterprise Synergy 480 Gen10 Compute Module | ssj_ops@100% = 5,887,236 ssj_ops@100% per JVM = 1,471,809 |
||||
| Test Sponsor: | Hewlett Packard Enterprise | SPEC License #: | 3 | Test Method: | Multi Node |
| Tested By: | Hewlett Packard Enterprise | Test Location: | Houston, TX, USA | Test Date: | Mar 12, 2019 |
| Hardware Availability: | Apr-2019 | Software Availability: | Mar-2019 | Publication: | Apr 2, 2019 |
| System Source: | Single Supplier | System Designation: | Server | Power Provisioning: | Line-powered |
| Target Load | Actual Load | ssj_ops | |
|---|---|---|---|
| Target | Actual | ||
| Calibration 1 | 5,911,491 | ||
| Calibration 2 | 5,905,253 | ||
| Calibration 3 | 5,905,601 | ||
| ssj_ops@calibrated=5,905,427 | |||
| 100% | 99.7% | 5,905,427 | 5,887,236 |
| 90% | 90.1% | 5,314,885 | 5,319,284 |
| 80% | 80.0% | 4,724,342 | 4,726,671 |
| 70% | 69.9% | 4,133,799 | 4,129,099 |
| 60% | 59.9% | 3,543,256 | 3,535,683 |
| 50% | 50.1% | 2,952,714 | 2,957,323 |
| 40% | 39.9% | 2,362,171 | 2,357,368 |
| 30% | 30.0% | 1,771,628 | 1,772,590 |
| 20% | 20.0% | 1,181,085 | 1,179,377 |
| 10% | 10.0% | 590,543 | 591,802 |
| Active Idle | 0 | 0 | |

| Set Identifier: | SUT |
| Set Description: | System Under Test |
| # of Identical Nodes: | 8 |
| Comment: | SUT |
| Hardware | |
|---|---|
| Hardware Vendor: | Hewlett Packard Enterprise |
| Model: | Synergy 480 Gen10 Compute Module |
| Form Factor: | blade |
| CPU Name: | Intel Xeon Platinum 8280 @ 2.70GHz |
| CPU Characteristics: | 28-Core, 2.70 GHz, 38.5MB L3 Cache |
| CPU Frequency (MHz): | 2700 |
| CPU(s) Enabled: | 56 cores, 2 chips, 28 cores/chip |
| Hardware Threads: | 112 (2 / core) |
| CPU(s) Orderable: | 1,2 chips |
| Primary Cache: | 32 KB I + 32 KB D on chip per core |
| Secondary Cache: | 1 MB I+D on chip per core |
| Tertiary Cache: | 39424 KB I+D on chip per chip |
| Other Cache: | None |
| Memory Amount (GB): | 192 |
| # and size of DIMM: | 12 x 16384 MB |
| Memory Details: | 12 x 16GB 2Rx8 PC4-2933Y-R; slots 1, 3, 5, 8, 10 and 12 populated on each socket |
| Power Supply Quantity and Rating (W): | None |
| Power Supply Details: | N/A |
| Disk Drive: | 1 x HPE 480GB SATA 6G M.2 2280 (875498-B21) |
| Disk Controller: | HPE Smart Array S100i SR Gen10 |
| # and type of Network Interface Cards (NICs) Installed: | 1 x HPE Synergy 3820C 10/20Gb CNA |
| NICs Enabled in Firmware / OS / Connected: | 2/2/1 |
| Network Speed (Mbit): | 1000 |
| Keyboard: | None |
| Mouse: | None |
| Monitor: | None |
| Optical Drives: | No |
| Other Hardware: | None |
| Software | |
|---|---|
| Power Management: | Enabled (see SUT Notes) |
| Operating System (OS): | SUSE Linux Enterprise Server 12 SP4 |
| OS Version: | 4.12.14-94.41-default |
| Filesystem: | xfs |
| JVM Vendor: | Oracle Corporation |
| JVM Version: | Oracle Java HotSpot(TM) 64-Bit Server VM (build 24.80-b11, mixed mode), version 1.7.0_80 |
| JVM Command-line Options: | -server -Xmn19g -Xms21g -Xmx21g -XX:SurvivorRatio=1 -XX:TargetSurvivorRatio=99 -XX:AllocatePrefetchDistance=384 -XX:AllocatePrefetchLines=4 -XX:LoopUnrollLimit=37 -XX:InitialTenuringThreshold=12 -XX:MaxTenuringThreshold=15 -XX:ParallelGCThreads=28 -XX:InlineSmallCode=3900 -XX:MaxInlineSize=270 -XX:FreqInlineSize=2500 -XX:+AggressiveOpts -XX:+UseLargePages -XX:+UseParallelOldGC |
| JVM Affinity: | numactl --cpunodebind=[0-3] --localalloc |
| JVM Instances: | 4 |
| JVM Initial Heap (MB): | 21000 |
| JVM Maximum Heap (MB): | 21000 |
| JVM Address Bits: | 64 |
| Boot Firmware Version: | I42 v2.00 (02/02/2019) |
| Management Firmware Version: | 1.40 Feb 05 2019 |
| Workload Version: | SSJ 1.2.10 |
| Director Location: | Controller |
| Other Software: | HPE Service Pack for ProLiant (SPP) - Version 2019.03.0 (Mar 2019) |
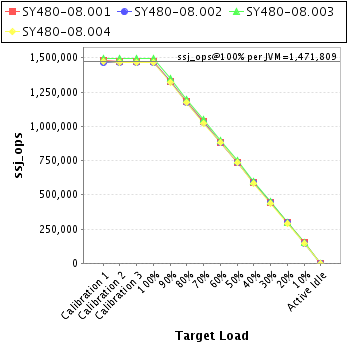
| JVM Instance | ssj_ops@100% |
|---|---|
| SY480-08.001 | 1,470,471 |
| SY480-08.002 | 1,462,463 |
| SY480-08.003 | 1,491,860 |
| SY480-08.004 | 1,462,442 |
| ssj_ops@100% | 5,887,236 |
| ssj_ops@100% per JVM | 1,471,809 |
| Target Load | Actual Load | ssj_ops | |
|---|---|---|---|
| Target | Actual | ||
| Calibration 1 | 1,479,798 | ||
| Calibration 2 | 1,474,696 | ||
| Calibration 3 | 1,475,932 | ||
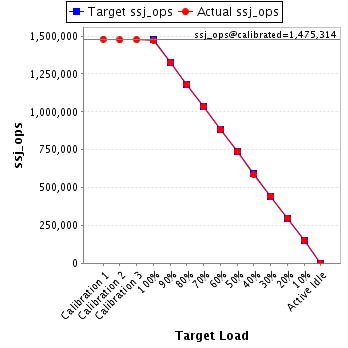
| ssj_ops@calibrated=1,475,314 | |||
| 100% | 99.7% | 1,475,314 | 1,470,471 |
| 90% | 89.9% | 1,327,783 | 1,325,831 |
| 80% | 80.0% | 1,180,251 | 1,180,311 |
| 70% | 70.1% | 1,032,720 | 1,034,176 |
| 60% | 59.8% | 885,189 | 882,242 |
| 50% | 50.0% | 737,657 | 737,569 |
| 40% | 39.8% | 590,126 | 587,702 |
| 30% | 30.1% | 442,594 | 444,018 |
| 20% | 20.0% | 295,063 | 295,296 |
| 10% | 10.2% | 147,531 | 149,982 |
| Active Idle | 0 | 0 | |
| Target Load | Actual Load | ssj_ops | |
|---|---|---|---|
| Target | Actual | ||
| Calibration 1 | 1,464,852 | ||
| Calibration 2 | 1,466,630 | ||
| Calibration 3 | 1,466,283 | ||
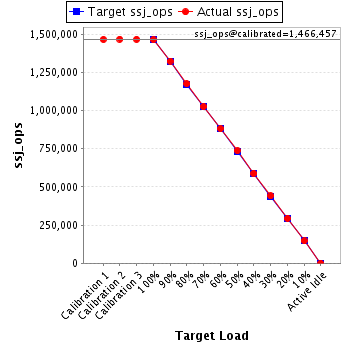
| ssj_ops@calibrated=1,466,457 | |||
| 100% | 99.7% | 1,466,457 | 1,462,463 |
| 90% | 90.3% | 1,319,811 | 1,323,523 |
| 80% | 80.1% | 1,173,165 | 1,175,139 |
| 70% | 69.9% | 1,026,520 | 1,025,092 |
| 60% | 60.0% | 879,874 | 880,594 |
| 50% | 50.2% | 733,228 | 736,763 |
| 40% | 40.0% | 586,583 | 587,170 |
| 30% | 30.0% | 439,937 | 440,226 |
| 20% | 20.0% | 293,291 | 294,007 |
| 10% | 10.0% | 146,646 | 146,208 |
| Active Idle | 0 | 0 | |
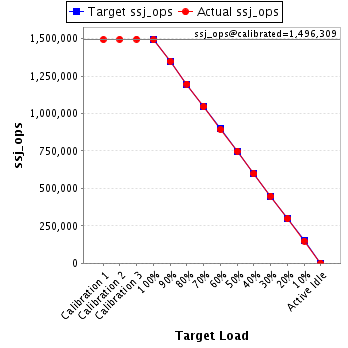
| Target Load | Actual Load | ssj_ops | |
|---|---|---|---|
| Target | Actual | ||
| Calibration 1 | 1,493,910 | ||
| Calibration 2 | 1,495,646 | ||
| Calibration 3 | 1,496,973 | ||
| ssj_ops@calibrated=1,496,309 | |||
| 100% | 99.7% | 1,496,309 | 1,491,860 |
| 90% | 90.2% | 1,346,678 | 1,349,089 |
| 80% | 80.0% | 1,197,047 | 1,197,416 |
| 70% | 69.9% | 1,047,416 | 1,046,366 |
| 60% | 59.7% | 897,786 | 893,543 |
| 50% | 50.0% | 748,155 | 748,088 |
| 40% | 39.9% | 598,524 | 597,359 |
| 30% | 30.0% | 448,893 | 449,305 |
| 20% | 19.9% | 299,262 | 297,636 |
| 10% | 9.9% | 149,631 | 148,584 |
| Active Idle | 0 | 0 | |
| Target Load | Actual Load | ssj_ops | |
|---|---|---|---|
| Target | Actual | ||
| Calibration 1 | 1,472,931 | ||
| Calibration 2 | 1,468,281 | ||
| Calibration 3 | 1,466,413 | ||
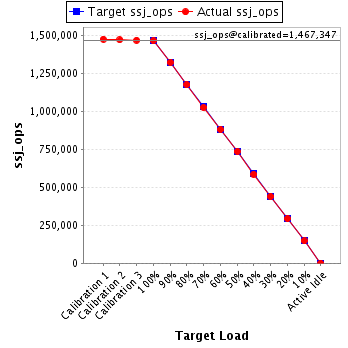
| ssj_ops@calibrated=1,467,347 | |||
| 100% | 99.7% | 1,467,347 | 1,462,442 |
| 90% | 90.0% | 1,320,612 | 1,320,839 |
| 80% | 80.0% | 1,173,878 | 1,173,805 |
| 70% | 69.7% | 1,027,143 | 1,023,465 |
| 60% | 59.9% | 880,408 | 879,304 |
| 50% | 50.1% | 733,674 | 734,903 |
| 40% | 39.9% | 586,939 | 585,138 |
| 30% | 29.9% | 440,204 | 439,041 |
| 20% | 19.9% | 293,469 | 292,438 |
| 10% | 10.0% | 146,735 | 147,029 |
| Active Idle | 0 | 0 | |