SPECpower_ssj2008
Host 'SY480-01' Performance Report
Copyright © 2007-2019 Standard Performance Evaluation Corporation
| Hewlett Packard Enterprise Synergy 480 Gen10 Compute Module | ssj_ops@100% = 5,974,315 ssj_ops@100% per JVM = 1,493,579 |
||||
| Test Sponsor: | Hewlett Packard Enterprise | SPEC License #: | 3 | Test Method: | Multi Node |
| Tested By: | Hewlett Packard Enterprise | Test Location: | Houston, TX, USA | Test Date: | Mar 12, 2019 |
| Hardware Availability: | Apr-2019 | Software Availability: | Mar-2019 | Publication: | Apr 2, 2019 |
| System Source: | Single Supplier | System Designation: | Server | Power Provisioning: | Line-powered |
| Target Load | Actual Load | ssj_ops | |
|---|---|---|---|
| Target | Actual | ||
| Calibration 1 | 5,992,870 | ||
| Calibration 2 | 5,987,594 | ||
| Calibration 3 | 5,992,068 | ||
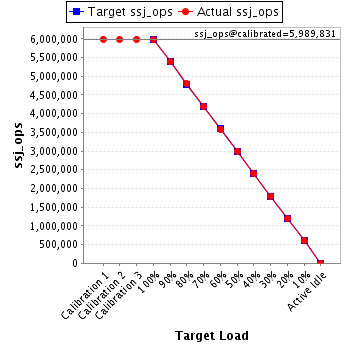
| ssj_ops@calibrated=5,989,831 | |||
| 100% | 99.7% | 5,989,831 | 5,974,315 |
| 90% | 90.0% | 5,390,848 | 5,392,338 |
| 80% | 80.1% | 4,791,865 | 4,794,987 |
| 70% | 70.0% | 4,192,881 | 4,194,302 |
| 60% | 59.9% | 3,593,898 | 3,589,944 |
| 50% | 50.0% | 2,994,915 | 2,993,037 |
| 40% | 40.0% | 2,395,932 | 2,395,228 |
| 30% | 30.0% | 1,796,949 | 1,798,463 |
| 20% | 20.0% | 1,197,966 | 1,200,878 |
| 10% | 10.0% | 598,983 | 598,625 |
| Active Idle | 0 | 0 | |
| Set Identifier: | SUT |
| Set Description: | System Under Test |
| # of Identical Nodes: | 6 |
| Comment: | SUT |
| Hardware | |
|---|---|
| Hardware Vendor: | Hewlett Packard Enterprise |
| Model: | Synergy 480 Gen10 Compute Module |
| Form Factor: | blade |
| CPU Name: | Intel Xeon Platinum 8280 @ 2.70GHz |
| CPU Characteristics: | 28-Core, 2.70 GHz, 38.5MB L3 Cache |
| CPU Frequency (MHz): | 2700 |
| CPU(s) Enabled: | 56 cores, 2 chips, 28 cores/chip |
| Hardware Threads: | 112 (2 / core) |
| CPU(s) Orderable: | 1,2 chips |
| Primary Cache: | 32 KB I + 32 KB D on chip per core |
| Secondary Cache: | 1 MB I+D on chip per core |
| Tertiary Cache: | 39424 KB I+D on chip per chip |
| Other Cache: | None |
| Memory Amount (GB): | 192 |
| # and size of DIMM: | 12 x 16384 MB |
| Memory Details: | 12 x 16GB 2Rx8 PC4-2933Y-R; slots 1, 3, 5, 8, 10 and 12 populated on each socket |
| Power Supply Quantity and Rating (W): | None |
| Power Supply Details: | N/A |
| Disk Drive: | 1 x HPE 480GB SATA 6G M.2 2280 (875498-B21) |
| Disk Controller: | HPE Smart Array S100i SR Gen10 |
| # and type of Network Interface Cards (NICs) Installed: | 1 x HPE Synergy 3820C 10/20Gb CNA |
| NICs Enabled in Firmware / OS / Connected: | 2/2/1 |
| Network Speed (Mbit): | 1000 |
| Keyboard: | None |
| Mouse: | None |
| Monitor: | None |
| Optical Drives: | No |
| Other Hardware: | None |
| Software | |
|---|---|
| Power Management: | Enabled (see SUT Notes) |
| Operating System (OS): | SUSE Linux Enterprise Server 12 SP4 |
| OS Version: | 4.12.14-94.41-default |
| Filesystem: | xfs |
| JVM Vendor: | Oracle Corporation |
| JVM Version: | Oracle Java HotSpot(TM) 64-Bit Server VM (build 24.80-b11, mixed mode), version 1.7.0_80 |
| JVM Command-line Options: | -server -Xmn19g -Xms21g -Xmx21g -XX:SurvivorRatio=1 -XX:TargetSurvivorRatio=99 -XX:AllocatePrefetchDistance=384 -XX:AllocatePrefetchLines=4 -XX:LoopUnrollLimit=37 -XX:InitialTenuringThreshold=12 -XX:MaxTenuringThreshold=15 -XX:ParallelGCThreads=28 -XX:InlineSmallCode=3900 -XX:MaxInlineSize=270 -XX:FreqInlineSize=2500 -XX:+AggressiveOpts -XX:+UseLargePages -XX:+UseParallelOldGC |
| JVM Affinity: | numactl --cpunodebind=[0-3] --localalloc |
| JVM Instances: | 4 |
| JVM Initial Heap (MB): | 21000 |
| JVM Maximum Heap (MB): | 21000 |
| JVM Address Bits: | 64 |
| Boot Firmware Version: | I42 v2.00 (02/02/2019) |
| Management Firmware Version: | 1.40 Feb 05 2019 |
| Workload Version: | SSJ 1.2.10 |
| Director Location: | Controller |
| Other Software: | HPE Service Pack for ProLiant (SPP) - Version 2019.03.0 (Mar 2019) |
| JVM Instance | ssj_ops@100% |
|---|---|
| SY480-01.001 | 1,494,717 |
| SY480-01.002 | 1,501,534 |
| SY480-01.003 | 1,493,907 |
| SY480-01.004 | 1,484,157 |
| ssj_ops@100% | 5,974,315 |
| ssj_ops@100% per JVM | 1,493,579 |

| Target Load | Actual Load | ssj_ops | |
|---|---|---|---|
| Target | Actual | ||
| Calibration 1 | 1,498,683 | ||
| Calibration 2 | 1,496,373 | ||
| Calibration 3 | 1,500,486 | ||
| ssj_ops@calibrated=1,498,430 | |||
| 100% | 99.8% | 1,498,430 | 1,494,717 |
| 90% | 89.8% | 1,348,587 | 1,346,157 |
| 80% | 80.1% | 1,198,744 | 1,200,047 |
| 70% | 70.2% | 1,048,901 | 1,051,160 |
| 60% | 59.9% | 899,058 | 898,146 |
| 50% | 49.9% | 749,215 | 748,204 |
| 40% | 40.0% | 599,372 | 599,743 |
| 30% | 30.0% | 449,529 | 449,853 |
| 20% | 20.1% | 299,686 | 300,628 |
| 10% | 10.0% | 149,843 | 150,012 |
| Active Idle | 0 | 0 | |

| Target Load | Actual Load | ssj_ops | |
|---|---|---|---|
| Target | Actual | ||
| Calibration 1 | 1,510,000 | ||
| Calibration 2 | 1,505,305 | ||
| Calibration 3 | 1,506,438 | ||
| ssj_ops@calibrated=1,505,872 | |||
| 100% | 99.7% | 1,505,872 | 1,501,534 |
| 90% | 90.0% | 1,355,284 | 1,355,056 |
| 80% | 80.1% | 1,204,697 | 1,205,604 |
| 70% | 69.8% | 1,054,110 | 1,051,800 |
| 60% | 60.0% | 903,523 | 903,302 |
| 50% | 50.0% | 752,936 | 752,833 |
| 40% | 39.9% | 602,349 | 600,517 |
| 30% | 30.0% | 451,761 | 452,339 |
| 20% | 20.0% | 301,174 | 301,848 |
| 10% | 10.0% | 150,587 | 150,187 |
| Active Idle | 0 | 0 | |

| Target Load | Actual Load | ssj_ops | |
|---|---|---|---|
| Target | Actual | ||
| Calibration 1 | 1,493,866 | ||
| Calibration 2 | 1,496,376 | ||
| Calibration 3 | 1,493,962 | ||
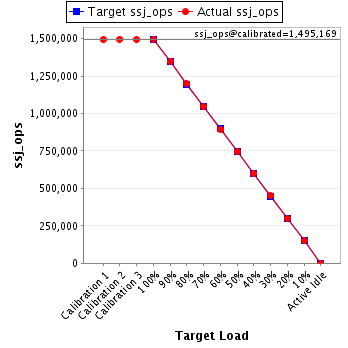
| ssj_ops@calibrated=1,495,169 | |||
| 100% | 99.9% | 1,495,169 | 1,493,907 |
| 90% | 90.2% | 1,345,652 | 1,348,301 |
| 80% | 80.2% | 1,196,135 | 1,198,717 |
| 70% | 69.9% | 1,046,618 | 1,045,228 |
| 60% | 59.9% | 897,101 | 896,257 |
| 50% | 49.9% | 747,585 | 746,007 |
| 40% | 40.1% | 598,068 | 599,487 |
| 30% | 30.1% | 448,551 | 449,328 |
| 20% | 20.1% | 299,034 | 300,036 |
| 10% | 10.0% | 149,517 | 149,628 |
| Active Idle | 0 | 0 | |
| Target Load | Actual Load | ssj_ops | |
|---|---|---|---|
| Target | Actual | ||
| Calibration 1 | 1,490,321 | ||
| Calibration 2 | 1,489,539 | ||
| Calibration 3 | 1,491,182 | ||
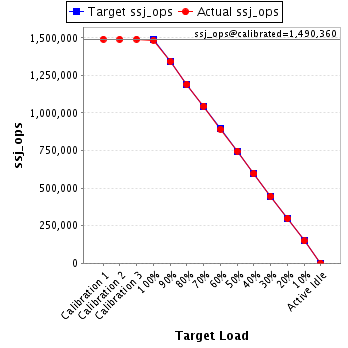
| ssj_ops@calibrated=1,490,360 | |||
| 100% | 99.6% | 1,490,360 | 1,484,157 |
| 90% | 90.1% | 1,341,324 | 1,342,824 |
| 80% | 79.9% | 1,192,288 | 1,190,618 |
| 70% | 70.2% | 1,043,252 | 1,046,115 |
| 60% | 59.9% | 894,216 | 892,238 |
| 50% | 50.1% | 745,180 | 745,993 |
| 40% | 40.0% | 596,144 | 595,481 |
| 30% | 30.0% | 447,108 | 446,943 |
| 20% | 20.0% | 298,072 | 298,367 |
| 10% | 10.0% | 149,036 | 148,798 |
| Active Idle | 0 | 0 | |