SPECpower_ssj2008
Host 'SY480-02' Performance Report
Copyright © 2007-2019 Standard Performance Evaluation Corporation
| Hewlett Packard Enterprise Synergy 480 Gen10 Compute Module | ssj_ops@100% = 5,902,088 ssj_ops@100% per JVM = 1,475,522 |
||||
| Test Sponsor: | Hewlett Packard Enterprise | SPEC License #: | 3 | Test Method: | Multi Node |
| Tested By: | Hewlett Packard Enterprise | Test Location: | Houston, TX, USA | Test Date: | Mar 12, 2019 |
| Hardware Availability: | Apr-2019 | Software Availability: | Mar-2019 | Publication: | Apr 2, 2019 |
| System Source: | Single Supplier | System Designation: | Server | Power Provisioning: | Line-powered |
| Target Load | Actual Load | ssj_ops | |
|---|---|---|---|
| Target | Actual | ||
| Calibration 1 | 5,930,365 | ||
| Calibration 2 | 5,921,133 | ||
| Calibration 3 | 5,924,675 | ||
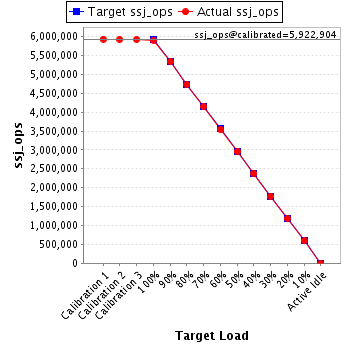
| ssj_ops@calibrated=5,922,904 | |||
| 100% | 99.6% | 5,922,904 | 5,902,088 |
| 90% | 90.0% | 5,330,614 | 5,331,129 |
| 80% | 79.9% | 4,738,323 | 4,733,116 |
| 70% | 70.0% | 4,146,033 | 4,146,301 |
| 60% | 60.0% | 3,553,742 | 3,551,224 |
| 50% | 49.9% | 2,961,452 | 2,952,669 |
| 40% | 40.1% | 2,369,162 | 2,372,833 |
| 30% | 30.0% | 1,776,871 | 1,776,970 |
| 20% | 20.0% | 1,184,581 | 1,185,729 |
| 10% | 10.1% | 592,290 | 595,556 |
| Active Idle | 0 | 0 | |
| Set Identifier: | SUT |
| Set Description: | System Under Test |
| # of Identical Nodes: | 6 |
| Comment: | SUT |
| Hardware | |
|---|---|
| Hardware Vendor: | Hewlett Packard Enterprise |
| Model: | Synergy 480 Gen10 Compute Module |
| Form Factor: | blade |
| CPU Name: | Intel Xeon Platinum 8280 @ 2.70GHz |
| CPU Characteristics: | 28-Core, 2.70 GHz, 38.5MB L3 Cache |
| CPU Frequency (MHz): | 2700 |
| CPU(s) Enabled: | 56 cores, 2 chips, 28 cores/chip |
| Hardware Threads: | 112 (2 / core) |
| CPU(s) Orderable: | 1,2 chips |
| Primary Cache: | 32 KB I + 32 KB D on chip per core |
| Secondary Cache: | 1 MB I+D on chip per core |
| Tertiary Cache: | 39424 KB I+D on chip per chip |
| Other Cache: | None |
| Memory Amount (GB): | 192 |
| # and size of DIMM: | 12 x 16384 MB |
| Memory Details: | 12 x 16GB 2Rx8 PC4-2933Y-R; slots 1, 3, 5, 8, 10 and 12 populated on each socket |
| Power Supply Quantity and Rating (W): | None |
| Power Supply Details: | N/A |
| Disk Drive: | 1 x HPE 480GB SATA 6G M.2 2280 (875498-B21) |
| Disk Controller: | HPE Smart Array S100i SR Gen10 |
| # and type of Network Interface Cards (NICs) Installed: | 1 x HPE Synergy 3820C 10/20Gb CNA |
| NICs Enabled in Firmware / OS / Connected: | 2/2/1 |
| Network Speed (Mbit): | 1000 |
| Keyboard: | None |
| Mouse: | None |
| Monitor: | None |
| Optical Drives: | No |
| Other Hardware: | None |
| Software | |
|---|---|
| Power Management: | Enabled (see SUT Notes) |
| Operating System (OS): | SUSE Linux Enterprise Server 12 SP4 |
| OS Version: | 4.12.14-94.41-default |
| Filesystem: | xfs |
| JVM Vendor: | Oracle Corporation |
| JVM Version: | Oracle Java HotSpot(TM) 64-Bit Server VM (build 24.80-b11, mixed mode), version 1.7.0_80 |
| JVM Command-line Options: | -server -Xmn19g -Xms21g -Xmx21g -XX:SurvivorRatio=1 -XX:TargetSurvivorRatio=99 -XX:AllocatePrefetchDistance=384 -XX:AllocatePrefetchLines=4 -XX:LoopUnrollLimit=37 -XX:InitialTenuringThreshold=12 -XX:MaxTenuringThreshold=15 -XX:ParallelGCThreads=28 -XX:InlineSmallCode=3900 -XX:MaxInlineSize=270 -XX:FreqInlineSize=2500 -XX:+AggressiveOpts -XX:+UseLargePages -XX:+UseParallelOldGC |
| JVM Affinity: | numactl --cpunodebind=[0-3] --localalloc |
| JVM Instances: | 4 |
| JVM Initial Heap (MB): | 21000 |
| JVM Maximum Heap (MB): | 21000 |
| JVM Address Bits: | 64 |
| Boot Firmware Version: | I42 v2.00 (02/02/2019) |
| Management Firmware Version: | 1.40 Feb 05 2019 |
| Workload Version: | SSJ 1.2.10 |
| Director Location: | Controller |
| Other Software: | HPE Service Pack for ProLiant (SPP) - Version 2019.03.0 (Mar 2019) |
| JVM Instance | ssj_ops@100% |
|---|---|
| SY480-02.001 | 1,473,266 |
| SY480-02.002 | 1,462,163 |
| SY480-02.003 | 1,489,803 |
| SY480-02.004 | 1,476,857 |
| ssj_ops@100% | 5,902,088 |
| ssj_ops@100% per JVM | 1,475,522 |

| Target Load | Actual Load | ssj_ops | |
|---|---|---|---|
| Target | Actual | ||
| Calibration 1 | 1,484,468 | ||
| Calibration 2 | 1,479,354 | ||
| Calibration 3 | 1,478,726 | ||
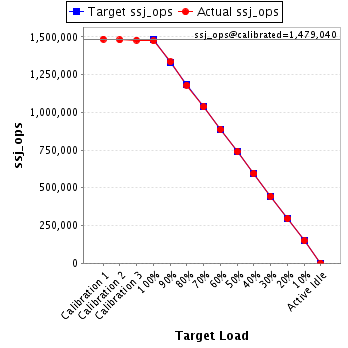
| ssj_ops@calibrated=1,479,040 | |||
| 100% | 99.6% | 1,479,040 | 1,473,266 |
| 90% | 90.2% | 1,331,136 | 1,334,047 |
| 80% | 79.8% | 1,183,232 | 1,179,918 |
| 70% | 70.1% | 1,035,328 | 1,036,135 |
| 60% | 59.9% | 887,424 | 886,640 |
| 50% | 50.0% | 739,520 | 739,904 |
| 40% | 40.1% | 591,616 | 593,544 |
| 30% | 30.0% | 443,712 | 443,757 |
| 20% | 20.0% | 295,808 | 295,774 |
| 10% | 10.1% | 147,904 | 149,695 |
| Active Idle | 0 | 0 | |
| Target Load | Actual Load | ssj_ops | |
|---|---|---|---|
| Target | Actual | ||
| Calibration 1 | 1,468,433 | ||
| Calibration 2 | 1,466,808 | ||
| Calibration 3 | 1,468,356 | ||
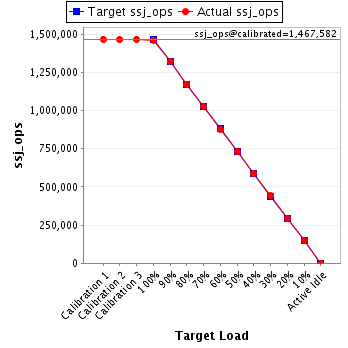
| ssj_ops@calibrated=1,467,582 | |||
| 100% | 99.6% | 1,467,582 | 1,462,163 |
| 90% | 90.0% | 1,320,824 | 1,321,215 |
| 80% | 80.0% | 1,174,066 | 1,174,301 |
| 70% | 70.1% | 1,027,308 | 1,028,407 |
| 60% | 59.9% | 880,549 | 878,489 |
| 50% | 49.9% | 733,791 | 732,973 |
| 40% | 40.0% | 587,033 | 586,353 |
| 30% | 30.1% | 440,275 | 441,523 |
| 20% | 20.0% | 293,516 | 293,679 |
| 10% | 10.0% | 146,758 | 146,857 |
| Active Idle | 0 | 0 | |
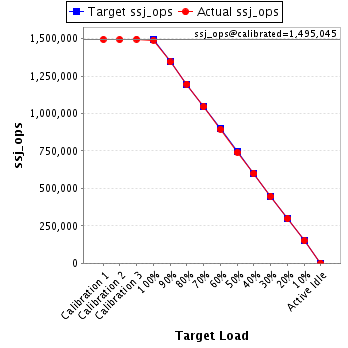
| Target Load | Actual Load | ssj_ops | |
|---|---|---|---|
| Target | Actual | ||
| Calibration 1 | 1,494,464 | ||
| Calibration 2 | 1,493,562 | ||
| Calibration 3 | 1,496,527 | ||
| ssj_ops@calibrated=1,495,045 | |||
| 100% | 99.6% | 1,495,045 | 1,489,803 |
| 90% | 89.9% | 1,345,540 | 1,344,334 |
| 80% | 80.0% | 1,196,036 | 1,195,880 |
| 70% | 69.9% | 1,046,531 | 1,045,191 |
| 60% | 59.9% | 897,027 | 895,748 |
| 50% | 49.5% | 747,522 | 740,490 |
| 40% | 40.0% | 598,018 | 598,515 |
| 30% | 29.9% | 448,513 | 447,302 |
| 20% | 19.9% | 299,009 | 297,721 |
| 10% | 10.1% | 149,504 | 150,997 |
| Active Idle | 0 | 0 | |
| Target Load | Actual Load | ssj_ops | |
|---|---|---|---|
| Target | Actual | ||
| Calibration 1 | 1,483,000 | ||
| Calibration 2 | 1,481,408 | ||
| Calibration 3 | 1,481,065 | ||
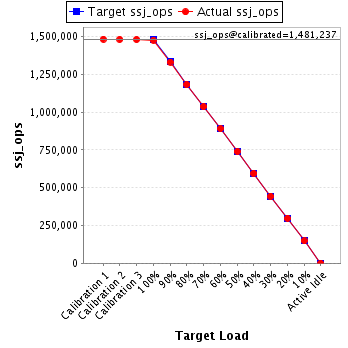
| ssj_ops@calibrated=1,481,237 | |||
| 100% | 99.7% | 1,481,237 | 1,476,857 |
| 90% | 89.9% | 1,333,113 | 1,331,533 |
| 80% | 79.9% | 1,184,989 | 1,183,017 |
| 70% | 70.0% | 1,036,866 | 1,036,568 |
| 60% | 60.1% | 888,742 | 890,348 |
| 50% | 49.9% | 740,618 | 739,302 |
| 40% | 40.1% | 592,495 | 594,421 |
| 30% | 30.0% | 444,371 | 444,388 |
| 20% | 20.2% | 296,247 | 298,555 |
| 10% | 10.0% | 148,124 | 148,008 |
| Active Idle | 0 | 0 | |