SPECpower_ssj2008
Host 'NODE04' Performance Report
Copyright © 2007-2019 Standard Performance Evaluation Corporation
| Hewlett Packard Enterprise Synergy 480 Gen10 Compute Module | ssj_ops@100% = 5,772,087 ssj_ops@100% per JVM = 1,443,022 |
||||
| Test Sponsor: | Hewlett Packard Enterprise | SPEC License #: | 3 | Test Method: | Multi Node |
| Tested By: | Hewlett Packard Enterprise | Test Location: | Houston, TX, USA | Test Date: | Mar 27, 2019 |
| Hardware Availability: | Apr-2019 | Software Availability: | Mar-2019 | Publication: | May 8, 2019 |
| System Source: | Single Supplier | System Designation: | Server | Power Provisioning: | Line-powered |
| Target Load | Actual Load | ssj_ops | |
|---|---|---|---|
| Target | Actual | ||
| Calibration 1 | 5,784,563 | ||
| Calibration 2 | 5,786,435 | ||
| Calibration 3 | 5,792,825 | ||
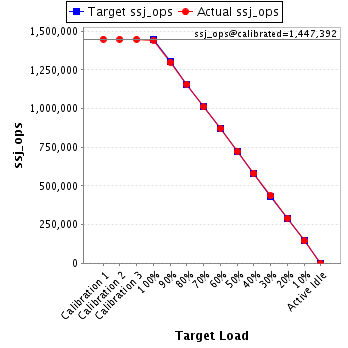
| ssj_ops@calibrated=5,789,630 | |||
| 100% | 99.7% | 5,789,630 | 5,772,087 |
| 90% | 89.9% | 5,210,667 | 5,204,864 |
| 80% | 80.0% | 4,631,704 | 4,632,629 |
| 70% | 70.0% | 4,052,741 | 4,054,729 |
| 60% | 60.0% | 3,473,778 | 3,472,476 |
| 50% | 50.0% | 2,894,815 | 2,896,015 |
| 40% | 40.0% | 2,315,852 | 2,315,042 |
| 30% | 30.0% | 1,736,889 | 1,735,502 |
| 20% | 20.0% | 1,157,926 | 1,157,605 |
| 10% | 10.0% | 578,963 | 578,927 |
| Active Idle | 0 | 0 | |
| Set Identifier: | SUT |
| Set Description: | System Under Test |
| # of Identical Nodes: | 5 |
| Comment: | SUT |
| Hardware | |
|---|---|
| Hardware Vendor: | Hewlett Packard Enterprise |
| Model: | Synergy 480 Gen10 Compute Module |
| Form Factor: | 7U |
| CPU Name: | Intel Xeon Platinum 8280 @ 2.70GHz (Intel Turbo Boost Technology up to 4.00 GHz) |
| CPU Characteristics: | 28-Core, 2.70 GHz, 38.5MB L3 Cache |
| CPU Frequency (MHz): | 2700 |
| CPU(s) Enabled: | 56 cores, 2 chips, 28 cores/chip |
| Hardware Threads: | 112 (2 / core) |
| CPU(s) Orderable: | 1,2 chips |
| Primary Cache: | 32 KB I + 32 KB D on chip per core |
| Secondary Cache: | 1 MB I+D on chip per core |
| Tertiary Cache: | 39424 KB I+D on chip per chip |
| Other Cache: | None |
| Memory Amount (GB): | 192 |
| # and size of DIMM: | 12 x 16384 MB |
| Memory Details: | 12 x 16GB 2Rx8 PC4-2933Y-R; slots 1, 3, 5, 8, 10 and 12 populated in each socket |
| Power Supply Quantity and Rating (W): | None |
| Power Supply Details: | N/A |
| Disk Drive: | 1 x HPE 240GB 6G SATA M.2 SSD (875488-B21) |
| Disk Controller: | HPE Smart Array S100i SR Gen10 |
| # and type of Network Interface Cards (NICs) Installed: | 1 x HPE Synergy 3820C 10/20Gb CNA |
| NICs Enabled in Firmware / OS / Connected: | 2/2/1 |
| Network Speed (Mbit): | 1000 |
| Keyboard: | None |
| Mouse: | None |
| Monitor: | None |
| Optical Drives: | No |
| Other Hardware: | H/S: Standard |
| Software | |
|---|---|
| Power Management: | Enabled (see SUT Notes) |
| Operating System (OS): | Windows Server 2012 R2 Datacenter |
| OS Version: | Version 6.3 (Build 9600) |
| Filesystem: | NTFS |
| JVM Vendor: | Oracle Corporation |
| JVM Version: | Oracle Java HotSpot(TM) 64-Bit Server VM (build 24.80-b11, mixed mode), version 1.7.0_80 |
| JVM Command-line Options: | -server -Xmn21000m -Xms24000m -Xmx24000m -XX:SurvivorRatio=1 -XX:TargetSurvivorRatio=99 -XX:AllocatePrefetchDistance=256 -XX:AllocatePrefetchLines=4 -XX:LoopUnrollLimit=45 -XX:InitialTenuringThreshold=12 -XX:MaxTenuringThreshold=15 -XX:ParallelGCThreads=28 -XX:InlineSmallCode=3900 -XX:MaxInlineSize=270 -XX:FreqInlineSize=2500 -XX:+AggressiveOpts -XX:+UseLargePages -XX:+UseParallelOldGC |
| JVM Affinity: | start /NODE [0,1,2,3] /AFFINITY [0xFFFFFFF] |
| JVM Instances: | 4 |
| JVM Initial Heap (MB): | 24000 |
| JVM Maximum Heap (MB): | 24000 |
| JVM Address Bits: | 64 |
| Boot Firmware Version: | I42 v2.00 (02/02/2019) |
| Management Firmware Version: | 1.40 Feb 05 2019 |
| Workload Version: | SSJ 1.2.10 |
| Director Location: | Controller |
| Other Software: | HPE Service Pack for ProLiant (SPP) Version: 2019.03.0, Microsoft Windows KB4056898, KB4338815 |
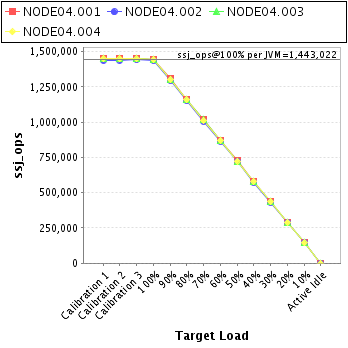
| JVM Instance | ssj_ops@100% |
|---|---|
| NODE04.001 | 1,446,842 |
| NODE04.002 | 1,436,538 |
| NODE04.003 | 1,446,068 |
| NODE04.004 | 1,442,639 |
| ssj_ops@100% | 5,772,087 |
| ssj_ops@100% per JVM | 1,443,022 |
| Target Load | Actual Load | ssj_ops | |
|---|---|---|---|
| Target | Actual | ||
| Calibration 1 | 1,449,360 | ||
| Calibration 2 | 1,450,342 | ||
| Calibration 3 | 1,453,141 | ||
| ssj_ops@calibrated=1,451,742 | |||
| 100% | 99.7% | 1,451,742 | 1,446,842 |
| 90% | 90.0% | 1,306,568 | 1,307,266 |
| 80% | 79.9% | 1,161,393 | 1,159,782 |
| 70% | 70.2% | 1,016,219 | 1,019,848 |
| 60% | 59.8% | 871,045 | 867,517 |
| 50% | 50.1% | 725,871 | 726,699 |
| 40% | 40.0% | 580,697 | 580,989 |
| 30% | 29.9% | 435,523 | 434,498 |
| 20% | 20.0% | 290,348 | 289,778 |
| 10% | 9.9% | 145,174 | 144,046 |
| Active Idle | 0 | 0 | |
| Target Load | Actual Load | ssj_ops | |
|---|---|---|---|
| Target | Actual | ||
| Calibration 1 | 1,438,293 | ||
| Calibration 2 | 1,439,433 | ||
| Calibration 3 | 1,441,976 | ||
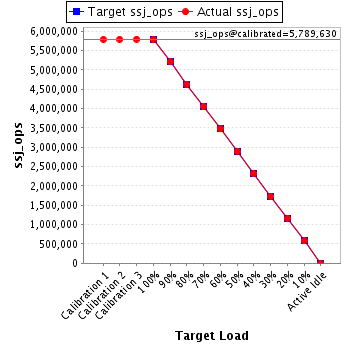
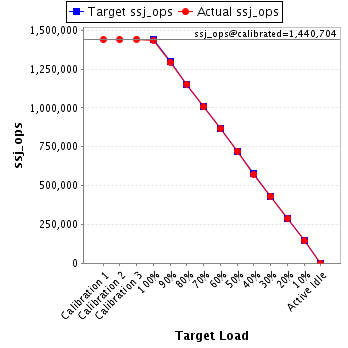
| ssj_ops@calibrated=1,440,704 | |||
| 100% | 99.7% | 1,440,704 | 1,436,538 |
| 90% | 89.9% | 1,296,634 | 1,294,820 |
| 80% | 80.0% | 1,152,564 | 1,153,189 |
| 70% | 69.8% | 1,008,493 | 1,006,183 |
| 60% | 60.0% | 864,423 | 864,841 |
| 50% | 50.1% | 720,352 | 721,890 |
| 40% | 39.8% | 576,282 | 573,109 |
| 30% | 30.0% | 432,211 | 431,959 |
| 20% | 20.0% | 288,141 | 287,668 |
| 10% | 10.0% | 144,070 | 144,062 |
| Active Idle | 0 | 0 | |
| Target Load | Actual Load | ssj_ops | |
|---|---|---|---|
| Target | Actual | ||
| Calibration 1 | 1,448,023 | ||
| Calibration 2 | 1,449,309 | ||
| Calibration 3 | 1,450,275 | ||
| ssj_ops@calibrated=1,449,792 | |||
| 100% | 99.7% | 1,449,792 | 1,446,068 |
| 90% | 89.8% | 1,304,813 | 1,302,563 |
| 80% | 80.1% | 1,159,833 | 1,161,658 |
| 70% | 70.2% | 1,014,854 | 1,018,075 |
| 60% | 59.9% | 869,875 | 868,083 |
| 50% | 49.9% | 724,896 | 722,861 |
| 40% | 40.0% | 579,917 | 579,868 |
| 30% | 29.9% | 434,938 | 434,139 |
| 20% | 19.9% | 289,958 | 288,319 |
| 10% | 10.1% | 144,979 | 146,287 |
| Active Idle | 0 | 0 | |

| Target Load | Actual Load | ssj_ops | |
|---|---|---|---|
| Target | Actual | ||
| Calibration 1 | 1,448,888 | ||
| Calibration 2 | 1,447,351 | ||
| Calibration 3 | 1,447,433 | ||
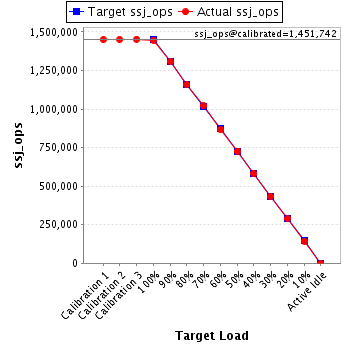
| ssj_ops@calibrated=1,447,392 | |||
| 100% | 99.7% | 1,447,392 | 1,442,639 |
| 90% | 89.8% | 1,302,653 | 1,300,215 |
| 80% | 80.0% | 1,157,913 | 1,158,000 |
| 70% | 69.8% | 1,013,174 | 1,010,623 |
| 60% | 60.2% | 868,435 | 872,035 |
| 50% | 50.1% | 723,696 | 724,564 |
| 40% | 40.1% | 578,957 | 581,076 |
| 30% | 30.0% | 434,218 | 434,906 |
| 20% | 20.2% | 289,478 | 291,840 |
| 10% | 10.0% | 144,739 | 144,532 |
| Active Idle | 0 | 0 | |