SPECpower_ssj2008
Host 'NODE09' Performance Report
Copyright © 2007-2019 Standard Performance Evaluation Corporation
| Hewlett Packard Enterprise Synergy 480 Gen10 Compute Module | ssj_ops@100% = 5,751,458 ssj_ops@100% per JVM = 1,437,865 |
||||
| Test Sponsor: | Hewlett Packard Enterprise | SPEC License #: | 3 | Test Method: | Multi Node |
| Tested By: | Hewlett Packard Enterprise | Test Location: | Houston, TX, USA | Test Date: | Mar 26, 2019 |
| Hardware Availability: | Apr-2019 | Software Availability: | Mar-2019 | Publication: | May 8, 2019 |
| System Source: | Single Supplier | System Designation: | Server | Power Provisioning: | Line-powered |
| Target Load | Actual Load | ssj_ops | |
|---|---|---|---|
| Target | Actual | ||
| Calibration 1 | 5,767,596 | ||
| Calibration 2 | 5,760,573 | ||
| Calibration 3 | 5,773,948 | ||
| ssj_ops@calibrated=5,767,261 | |||
| 100% | 99.7% | 5,767,261 | 5,751,458 |
| 90% | 90.2% | 5,190,535 | 5,200,499 |
| 80% | 80.0% | 4,613,809 | 4,615,663 |
| 70% | 69.9% | 4,037,083 | 4,032,559 |
| 60% | 60.0% | 3,460,356 | 3,458,300 |
| 50% | 50.0% | 2,883,630 | 2,884,771 |
| 40% | 39.9% | 2,306,904 | 2,298,738 |
| 30% | 30.0% | 1,730,178 | 1,727,944 |
| 20% | 20.0% | 1,153,452 | 1,154,600 |
| 10% | 10.0% | 576,726 | 577,822 |
| Active Idle | 0 | 0 | |

| Set Identifier: | SUT |
| Set Description: | System Under Test |
| # of Identical Nodes: | 10 |
| Comment: | SUT |
| Hardware | |
|---|---|
| Hardware Vendor: | Hewlett Packard Enterprise |
| Model: | Synergy 480 Gen10 Compute Module |
| Form Factor: | 7U |
| CPU Name: | Intel Xeon Platinum 8280 @ 2.70GHz (Intel Turbo Boost Technology up to 4.00 GHz) |
| CPU Characteristics: | 28-Core, 2.70 GHz, 38.5MB L3 Cache |
| CPU Frequency (MHz): | 2700 |
| CPU(s) Enabled: | 56 cores, 2 chips, 28 cores/chip |
| Hardware Threads: | 112 (2 / core) |
| CPU(s) Orderable: | 1,2 chips |
| Primary Cache: | 32 KB I + 32 KB D on chip per core |
| Secondary Cache: | 1 MB I+D on chip per core |
| Tertiary Cache: | 39424 KB I+D on chip per chip |
| Other Cache: | None |
| Memory Amount (GB): | 192 |
| # and size of DIMM: | 12 x 16384 MB |
| Memory Details: | 12 x 16GB 2Rx8 PC4-2933Y-R; slots 1, 3, 5, 8, 10 and 12 populated in each socket |
| Power Supply Quantity and Rating (W): | None |
| Power Supply Details: | N/A |
| Disk Drive: | 1 x HPE 240GB 6G SATA M.2 SSD (875488-B21) |
| Disk Controller: | HPE Smart Array S100i SR Gen10 |
| # and type of Network Interface Cards (NICs) Installed: | 1 x HPE Synergy 3820C 10/20Gb CNA |
| NICs Enabled in Firmware / OS / Connected: | 2/2/1 |
| Network Speed (Mbit): | 1000 |
| Keyboard: | None |
| Mouse: | None |
| Monitor: | None |
| Optical Drives: | No |
| Other Hardware: | H/S: Standard |
| Software | |
|---|---|
| Power Management: | Enabled (see SUT Notes) |
| Operating System (OS): | Windows Server 2012 R2 Datacenter |
| OS Version: | Version 6.3 (Build 9600) |
| Filesystem: | NTFS |
| JVM Vendor: | Oracle Corporation |
| JVM Version: | Oracle Java HotSpot(TM) 64-Bit Server VM (build 24.80-b11, mixed mode), version 1.7.0_80 |
| JVM Command-line Options: | -server -Xmn21000m -Xms24000m -Xmx24000m -XX:SurvivorRatio=1 -XX:TargetSurvivorRatio=99 -XX:AllocatePrefetchDistance=256 -XX:AllocatePrefetchLines=4 -XX:LoopUnrollLimit=45 -XX:InitialTenuringThreshold=12 -XX:MaxTenuringThreshold=15 -XX:ParallelGCThreads=28 -XX:InlineSmallCode=3900 -XX:MaxInlineSize=270 -XX:FreqInlineSize=2500 -XX:+AggressiveOpts -XX:+UseLargePages -XX:+UseParallelOldGC |
| JVM Affinity: | start /NODE [0,1,2,3] /AFFINITY [0xFFFFFFF] |
| JVM Instances: | 4 |
| JVM Initial Heap (MB): | 24000 |
| JVM Maximum Heap (MB): | 24000 |
| JVM Address Bits: | 64 |
| Boot Firmware Version: | I42 v2.00 (02/02/2019) |
| Management Firmware Version: | 1.40 Feb 05 2019 |
| Workload Version: | SSJ 1.2.10 |
| Director Location: | Controller |
| Other Software: | HPE Service Pack for ProLiant (SPP) Version: 2019.03.0, Microsoft Windows KB4056898, KB4338815 |
| JVM Instance | ssj_ops@100% |
|---|---|
| NODE09.001 | 1,448,334 |
| NODE09.002 | 1,450,960 |
| NODE09.003 | 1,431,653 |
| NODE09.004 | 1,420,511 |
| ssj_ops@100% | 5,751,458 |
| ssj_ops@100% per JVM | 1,437,865 |

| Target Load | Actual Load | ssj_ops | |
|---|---|---|---|
| Target | Actual | ||
| Calibration 1 | 1,453,901 | ||
| Calibration 2 | 1,452,547 | ||
| Calibration 3 | 1,456,681 | ||
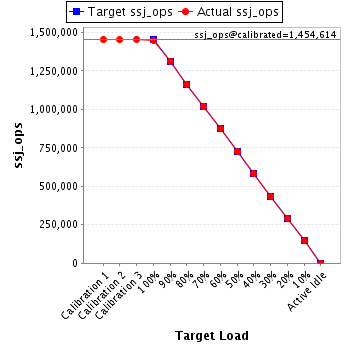
| ssj_ops@calibrated=1,454,614 | |||
| 100% | 99.6% | 1,454,614 | 1,448,334 |
| 90% | 90.3% | 1,309,152 | 1,313,854 |
| 80% | 80.0% | 1,163,691 | 1,163,524 |
| 70% | 70.1% | 1,018,230 | 1,020,184 |
| 60% | 60.1% | 872,768 | 874,000 |
| 50% | 50.0% | 727,307 | 727,845 |
| 40% | 39.9% | 581,846 | 580,665 |
| 30% | 29.8% | 436,384 | 433,478 |
| 20% | 20.0% | 290,923 | 291,363 |
| 10% | 10.1% | 145,461 | 146,330 |
| Active Idle | 0 | 0 | |
| Target Load | Actual Load | ssj_ops | |
|---|---|---|---|
| Target | Actual | ||
| Calibration 1 | 1,456,489 | ||
| Calibration 2 | 1,454,085 | ||
| Calibration 3 | 1,455,196 | ||
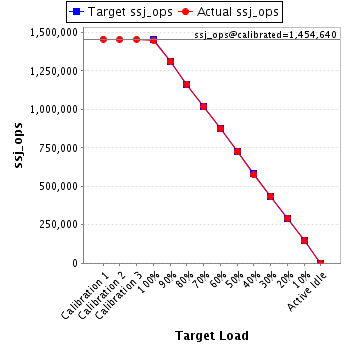
| ssj_ops@calibrated=1,454,640 | |||
| 100% | 99.7% | 1,454,640 | 1,450,960 |
| 90% | 90.1% | 1,309,176 | 1,311,027 |
| 80% | 80.1% | 1,163,712 | 1,164,769 |
| 70% | 69.9% | 1,018,248 | 1,016,450 |
| 60% | 60.0% | 872,784 | 872,813 |
| 50% | 50.0% | 727,320 | 727,000 |
| 40% | 39.6% | 581,856 | 575,418 |
| 30% | 30.0% | 436,392 | 435,758 |
| 20% | 20.0% | 290,928 | 290,826 |
| 10% | 10.0% | 145,464 | 145,187 |
| Active Idle | 0 | 0 | |
| Target Load | Actual Load | ssj_ops | |
|---|---|---|---|
| Target | Actual | ||
| Calibration 1 | 1,435,223 | ||
| Calibration 2 | 1,429,859 | ||
| Calibration 3 | 1,437,007 | ||
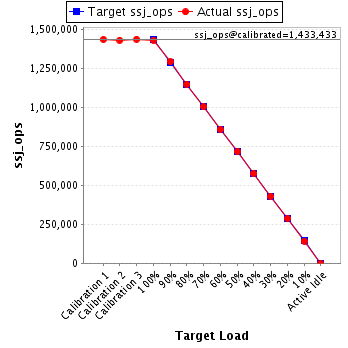
| ssj_ops@calibrated=1,433,433 | |||
| 100% | 99.9% | 1,433,433 | 1,431,653 |
| 90% | 90.2% | 1,290,090 | 1,293,271 |
| 80% | 80.1% | 1,146,746 | 1,148,528 |
| 70% | 70.0% | 1,003,403 | 1,002,888 |
| 60% | 59.9% | 860,060 | 858,430 |
| 50% | 50.0% | 716,717 | 716,538 |
| 40% | 40.1% | 573,373 | 574,497 |
| 30% | 30.0% | 430,030 | 430,259 |
| 20% | 20.0% | 286,687 | 287,225 |
| 10% | 9.9% | 143,343 | 142,313 |
| Active Idle | 0 | 0 | |
| Target Load | Actual Load | ssj_ops | |
|---|---|---|---|
| Target | Actual | ||
| Calibration 1 | 1,421,984 | ||
| Calibration 2 | 1,424,082 | ||
| Calibration 3 | 1,425,065 | ||
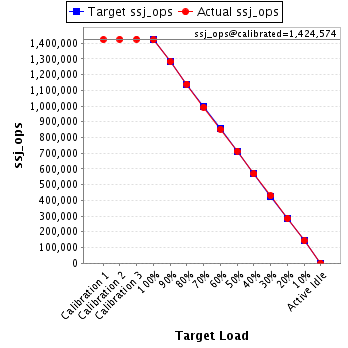
| ssj_ops@calibrated=1,424,574 | |||
| 100% | 99.7% | 1,424,574 | 1,420,511 |
| 90% | 90.0% | 1,282,116 | 1,282,347 |
| 80% | 79.9% | 1,139,659 | 1,138,842 |
| 70% | 69.7% | 997,202 | 993,037 |
| 60% | 59.9% | 854,744 | 853,057 |
| 50% | 50.1% | 712,287 | 713,389 |
| 40% | 39.9% | 569,829 | 568,158 |
| 30% | 30.1% | 427,372 | 428,448 |
| 20% | 20.0% | 284,915 | 285,187 |
| 10% | 10.1% | 142,457 | 143,993 |
| Active Idle | 0 | 0 | |