
SPECpower_ssj2008
Host 'NODE04' Performance Report
Copyright © 2007-2019 Standard Performance Evaluation Corporation
| Hewlett Packard Enterprise Synergy 480 Gen10 Compute Module | ssj_ops@100% = 5,758,612 ssj_ops@100% per JVM = 1,439,653 |
||||
| Test Sponsor: | Hewlett Packard Enterprise | SPEC License #: | 3 | Test Method: | Multi Node |
| Tested By: | Hewlett Packard Enterprise | Test Location: | Houston, TX, USA | Test Date: | Mar 26, 2019 |
| Hardware Availability: | Apr-2019 | Software Availability: | Mar-2019 | Publication: | May 8, 2019 |
| System Source: | Single Supplier | System Designation: | Server | Power Provisioning: | Line-powered |
| Target Load | Actual Load | ssj_ops | |
|---|---|---|---|
| Target | Actual | ||
| Calibration 1 | 5,783,239 | ||
| Calibration 2 | 5,773,430 | ||
| Calibration 3 | 5,778,057 | ||
| ssj_ops@calibrated=5,775,744 | |||
| 100% | 99.7% | 5,775,744 | 5,758,612 |
| 90% | 90.1% | 5,198,169 | 5,202,997 |
| 80% | 80.1% | 4,620,595 | 4,624,310 |
| 70% | 70.0% | 4,043,020 | 4,044,286 |
| 60% | 60.0% | 3,465,446 | 3,466,279 |
| 50% | 50.0% | 2,887,872 | 2,885,104 |
| 40% | 40.1% | 2,310,297 | 2,314,142 |
| 30% | 30.1% | 1,732,723 | 1,736,925 |
| 20% | 20.0% | 1,155,149 | 1,155,715 |
| 10% | 10.0% | 577,574 | 577,073 |
| Active Idle | 0 | 0 | |

| Set Identifier: | SUT |
| Set Description: | System Under Test |
| # of Identical Nodes: | 7 |
| Comment: | SUT |
| Hardware | |
|---|---|
| Hardware Vendor: | Hewlett Packard Enterprise |
| Model: | Synergy 480 Gen10 Compute Module |
| Form Factor: | 7U |
| CPU Name: | Intel Xeon Platinum 8280 @ 2.70GHz (Intel Turbo Boost Technology up to 4.00 GHz) |
| CPU Characteristics: | 28-Core, 2.70 GHz, 38.5MB L3 Cache |
| CPU Frequency (MHz): | 2700 |
| CPU(s) Enabled: | 56 cores, 2 chips, 28 cores/chip |
| Hardware Threads: | 112 (2 / core) |
| CPU(s) Orderable: | 1,2 chips |
| Primary Cache: | 32 KB I + 32 KB D on chip per core |
| Secondary Cache: | 1 MB I+D on chip per core |
| Tertiary Cache: | 39424 KB I+D on chip per chip |
| Other Cache: | None |
| Memory Amount (GB): | 192 |
| # and size of DIMM: | 12 x 16384 MB |
| Memory Details: | 12 x 16GB 2Rx8 PC4-2933Y-R; slots 1, 3, 5, 8, 10 and 12 populated in each socket |
| Power Supply Quantity and Rating (W): | None |
| Power Supply Details: | N/A |
| Disk Drive: | 1 x HPE 240GB 6G SATA M.2 SSD (875488-B21) |
| Disk Controller: | HPE Smart Array S100i SR Gen10 |
| # and type of Network Interface Cards (NICs) Installed: | 1 x HPE Synergy 3820C 10/20Gb CNA |
| NICs Enabled in Firmware / OS / Connected: | 2/2/1 |
| Network Speed (Mbit): | 1000 |
| Keyboard: | None |
| Mouse: | None |
| Monitor: | None |
| Optical Drives: | No |
| Other Hardware: | H/S: Standard |
| Software | |
|---|---|
| Power Management: | Enabled (see SUT Notes) |
| Operating System (OS): | Windows Server 2012 R2 Datacenter |
| OS Version: | Version 6.3 (Build 9600) |
| Filesystem: | NTFS |
| JVM Vendor: | Oracle Corporation |
| JVM Version: | Oracle Java HotSpot(TM) 64-Bit Server VM (build 24.80-b11, mixed mode), version 1.7.0_80 |
| JVM Command-line Options: | -server -Xmn21000m -Xms24000m -Xmx24000m -XX:SurvivorRatio=1 -XX:TargetSurvivorRatio=99 -XX:AllocatePrefetchDistance=256 -XX:AllocatePrefetchLines=4 -XX:LoopUnrollLimit=45 -XX:InitialTenuringThreshold=12 -XX:MaxTenuringThreshold=15 -XX:ParallelGCThreads=28 -XX:InlineSmallCode=3900 -XX:MaxInlineSize=270 -XX:FreqInlineSize=2500 -XX:+AggressiveOpts -XX:+UseLargePages -XX:+UseParallelOldGC |
| JVM Affinity: | start /NODE [0,1,2,3] /AFFINITY [0xFFFFFFF] |
| JVM Instances: | 4 |
| JVM Initial Heap (MB): | 21000 |
| JVM Maximum Heap (MB): | 21000 |
| JVM Address Bits: | 64 |
| Boot Firmware Version: | I42 v2.00 (02/02/2019) |
| Management Firmware Version: | 1.40 Feb 05 2019 |
| Workload Version: | SSJ 1.2.10 |
| Director Location: | Controller |
| Other Software: | HPE Service Pack for ProLiant (SPP) Version: 2019.03.0, Microsoft Windows KB4056898, KB4338815 |
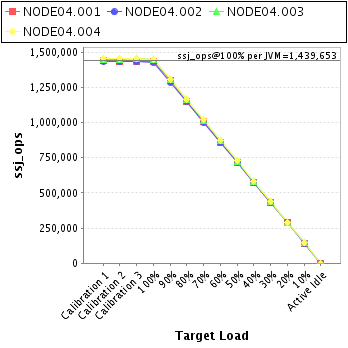
| JVM Instance | ssj_ops@100% |
|---|---|
| NODE04.001 | 1,432,060 |
| NODE04.002 | 1,428,857 |
| NODE04.003 | 1,446,137 |
| NODE04.004 | 1,451,558 |
| ssj_ops@100% | 5,758,612 |
| ssj_ops@100% per JVM | 1,439,653 |
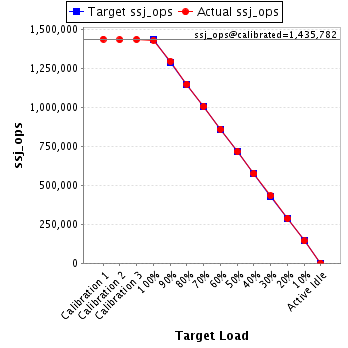
| Target Load | Actual Load | ssj_ops | |
|---|---|---|---|
| Target | Actual | ||
| Calibration 1 | 1,438,987 | ||
| Calibration 2 | 1,434,926 | ||
| Calibration 3 | 1,436,637 | ||
| ssj_ops@calibrated=1,435,782 | |||
| 100% | 99.7% | 1,435,782 | 1,432,060 |
| 90% | 90.3% | 1,292,204 | 1,296,221 |
| 80% | 80.0% | 1,148,625 | 1,149,242 |
| 70% | 70.2% | 1,005,047 | 1,007,272 |
| 60% | 60.0% | 861,469 | 860,860 |
| 50% | 49.9% | 717,891 | 716,627 |
| 40% | 40.0% | 574,313 | 574,482 |
| 30% | 30.1% | 430,735 | 432,858 |
| 20% | 20.1% | 287,156 | 287,951 |
| 10% | 10.0% | 143,578 | 143,410 |
| Active Idle | 0 | 0 | |
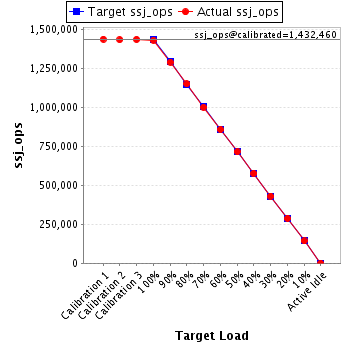
| Target Load | Actual Load | ssj_ops | |
|---|---|---|---|
| Target | Actual | ||
| Calibration 1 | 1,434,972 | ||
| Calibration 2 | 1,431,485 | ||
| Calibration 3 | 1,433,436 | ||
| ssj_ops@calibrated=1,432,460 | |||
| 100% | 99.7% | 1,432,460 | 1,428,857 |
| 90% | 89.9% | 1,289,214 | 1,287,728 |
| 80% | 80.2% | 1,145,968 | 1,148,996 |
| 70% | 69.8% | 1,002,722 | 999,818 |
| 60% | 59.8% | 859,476 | 856,818 |
| 50% | 49.8% | 716,230 | 713,498 |
| 40% | 40.1% | 572,984 | 574,926 |
| 30% | 30.1% | 429,738 | 430,463 |
| 20% | 20.1% | 286,492 | 287,279 |
| 10% | 10.0% | 143,246 | 142,900 |
| Active Idle | 0 | 0 | |
| Target Load | Actual Load | ssj_ops | |
|---|---|---|---|
| Target | Actual | ||
| Calibration 1 | 1,451,282 | ||
| Calibration 2 | 1,450,828 | ||
| Calibration 3 | 1,452,358 | ||
| ssj_ops@calibrated=1,451,593 | |||
| 100% | 99.6% | 1,451,593 | 1,446,137 |
| 90% | 90.2% | 1,306,434 | 1,309,270 |
| 80% | 80.0% | 1,161,275 | 1,160,873 |
| 70% | 70.0% | 1,016,115 | 1,015,597 |
| 60% | 60.2% | 870,956 | 873,427 |
| 50% | 50.0% | 725,797 | 726,091 |
| 40% | 40.1% | 580,637 | 582,079 |
| 30% | 30.0% | 435,478 | 436,003 |
| 20% | 20.0% | 290,319 | 290,353 |
| 10% | 10.0% | 145,159 | 145,456 |
| Active Idle | 0 | 0 | |

| Target Load | Actual Load | ssj_ops | |
|---|---|---|---|
| Target | Actual | ||
| Calibration 1 | 1,457,998 | ||
| Calibration 2 | 1,456,190 | ||
| Calibration 3 | 1,455,626 | ||
| ssj_ops@calibrated=1,455,908 | |||
| 100% | 99.7% | 1,455,908 | 1,451,558 |
| 90% | 90.0% | 1,310,317 | 1,309,777 |
| 80% | 80.0% | 1,164,726 | 1,165,200 |
| 70% | 70.2% | 1,019,136 | 1,021,600 |
| 60% | 60.1% | 873,545 | 875,174 |
| 50% | 50.1% | 727,954 | 728,888 |
| 40% | 40.0% | 582,363 | 582,654 |
| 30% | 30.1% | 436,772 | 437,601 |
| 20% | 19.9% | 291,182 | 290,133 |
| 10% | 10.0% | 145,591 | 145,308 |
| Active Idle | 0 | 0 | |
