Our basic motivation in creating the Benchmark Visualizer is to provide a suite of tools for the presentation and analysis of benchmark data. Traditionally the burden of both analysis and presentation is on the performance engineer. This is undesirable in two ways: the engineer must repeatedly perform a task for which there are few high level tools, and the data and format of the material presented are static and non-interactive. Moreover as the quantity of data increases and the analysis task becomes more complex (like regression testing), existing tools become unwieldy.
The GLperf benchmark requires a more robust and flexible tool set than is currently available. GLperf measures OpenGL graphics primitive performance at very high granularity. In fact it provides nearly 2000 data points and more than 200 graphs for each machine tested. To assemble and comprehend the data for one machine alone is nearly impossible with static graphing tools and spreadsheets (imagine competitive analysis!)
Architecture
Considering our motivation for robust and flexible tools, our broad design goals are:
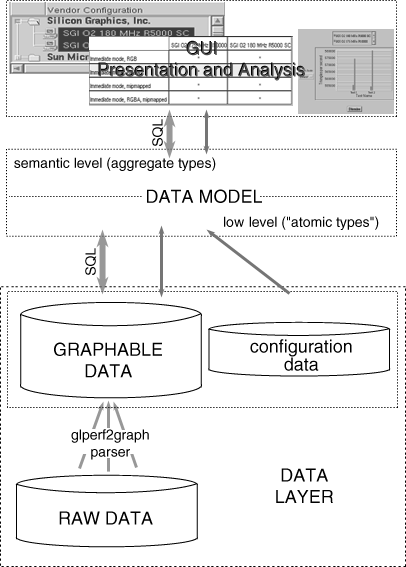
The diagram above illustrates the basic components of the Benchmark Visualizer for GLperf. Only the lowest layer, the raw data, and the glperf2graph parser are specific customizations for GLperf (see also Data Directory Structure). One of our goals is to provide a structure that allows data from any benchmark to be made available as graphable data. In the case of GLperf, the glperf2graph parser extracts test results from raw data files and compiles them into tabular data sets and metadata that are graphable. A similar parser can be written for almost any data or graphable data sets can be written by hand. In addition to graphable data, configuration data is required to determine what is made available to the user in the graphical user interface. In the current implementation, configuration data takes the form of hierarchical lists that describe data sets and vendor configurations for which those data sets are available (see also Configuration Files). Both the graphable data and configuration data may be modified at will without changing the interface code.
The Data Model layer provides the core functionality for the Benchmark Visualizer and the interface between the graphical user interface and the data layer. The data model can be divided into two parts, the low level "atomic" types and the semantic level aggregate types. The basic data structure in the low level is the Table. Algebraic and arithmetic operations are supported at the Table level. Using Tables as basic structures, we can manipulate graphable data in a row-wise or column-wise fashion. In fact the truly atomic data structure is the Row (and a Table is a collection of Rows). The Table model is sufficiently expressive (almost any graphable data we can imagine can be expressed as a Table), lightweight, and flexible (we can add and remove Rows and columns in a straightforward manner). In addition to graphable data, a Table also includes metadata describing the units of measurement for the data, titles, and the types of graphs that may be generated from the data. Aggregating Tables into DataSets gives us a semantic level at which to manipulate our data increasing our flexibility and expressivity just as with Rows and Tables. DataSets also support adding and removing Tables and arithmetic operations (which are distributed across the member Tables). By subclassing DataSets, we can also provide constraints on our data (for example, requiring all member Tables to have the same number of data points or the same units of measurement).
The graphical user interface provides something. For a detailed guide to using the Benchmark Visualizer graphical user interface, see The User Interface.
Architecture Overview
